
Histogram for Single Data Set
Loading the math board and drawing, please wait…
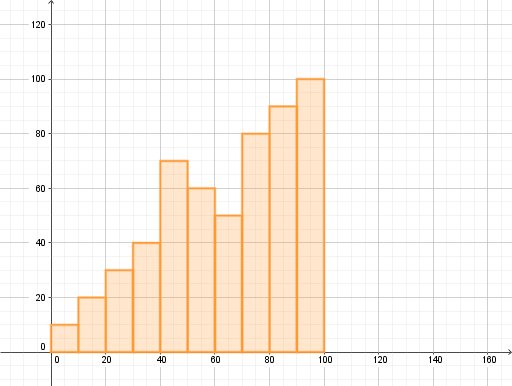
This example demonstrates a histogram for a single data set. A histogram is a statistical chart that shows the distribution of data. By setting the class boundaries and heights, the frequency distribution of the data can be visually observed. The example uses the Histogram command in GeoGebra, along with ClassBoundries and ClassHeights objects to construct the histogram. Suitable for students at the middle school level and above to learn statistics and data visualization.
GeoGebra Commands & Parameters
Histogram(ClassBoundries, ClassHeights) → A