
Graphs of Logarithmic Functions by Roger Lui (2)
Loading the math board and drawing, please wait…
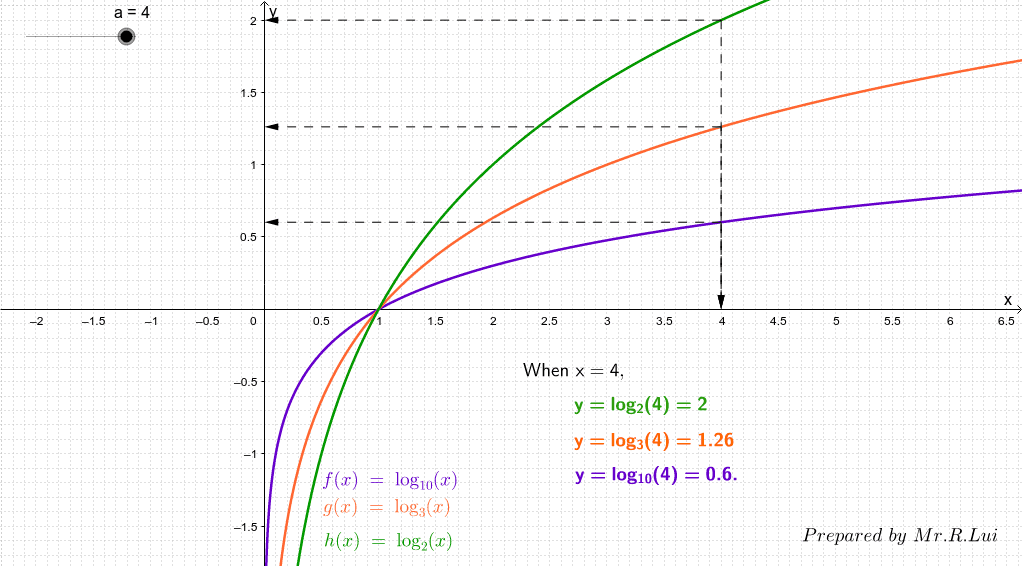
This example demonstrates the graphs of logarithmic functions with different bases. By adjusting parameters, you can observe the basic properties and image changes of logarithmic functions. The construction involves using Vector, Text, and other GeoGebra commands. Suitable for high school mathematics education and learning.
GeoGebra Commands & Parameters
Vector(A3, B3) → uVector(A2, B2) → vVector(A1, B1) → wVector(A3, A) → zVector(A2, A) → bVector(A1, A) → cText(f(a)) → text1Text(a) → text2Text(g(a)) → text5Text(h(a)) → text7
AI Drawing Prompt Reference
Draw logarithmic function graphs with different bases, showing the shape changes by adjusting parameters. Include three vectors indicating directions, three vectors from point A to different points, and three text labels displaying function values and parameter values, clearly illustrating the properties of logarithmic functions.
The prompt above was compiled from the original drawing commands and is for reference only.