
Graphs of Exponential Function y = k a^x: Parameter Exploration
Loading the math board and drawing, please wait…
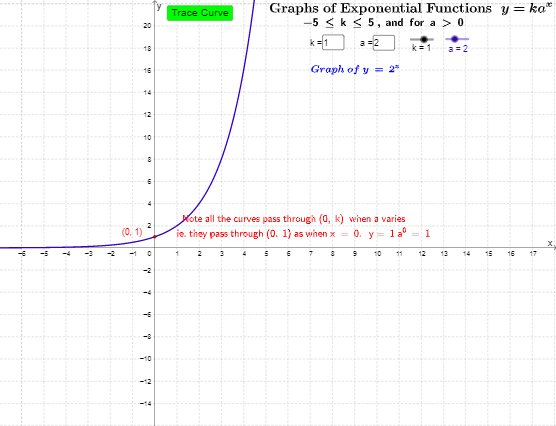
This GeoGebra example demonstrates the graphs of the exponential function y = k a^x and how the coefficient k and base a influence the curve’s shape, position, growth, and decay. It is designed for self-learning and classroom demonstration of exponential functions. Key mathematical concepts include exponential functions, function transformations, vertical stretching and compressing, horizontal scaling, asymptotic behavior, and the distinction between exponential growth (a > 1) and exponential decay (0 < a < 1). The construction relies on GeoGebra commands and objects such as Point, Textfield, inputBox, button, and text objects text1, text3, text4, text5, text6, text7, text8 for dynamic parameter display, together with f and f_{trace} for plotting the function graph and its trace, and variables a, k, b, c, q1, q2, C linked to interactive controls. Suitable for high school mathematics, teachers, and students exploring function graphs and parameter effects.
GeoGebra Commands & Parameters
Point(f_{trace}) → CTextfield(k) → inputBox1Textfield(a) → inputBox2
AI Drawing Prompt Reference
Draw a graph of the exponential function y = k * a^x. Include a function curve and two adjustable parameters, k and a. The curve should show effects of a on stretching or compressing, and k on vertical stretching or compressing. Display exponential growth (a>1) and decay (0<a<1). Ensure the graph is clear and parameters are intuitive for teaching and self-study.
The prompt above was compiled from the original drawing commands and is for reference only.