
Graphing Tangent Functions
Loading the math board and drawing, please wait…
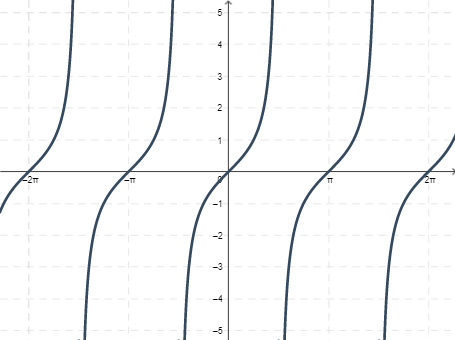
This example demonstrates how to graph tangent functions and analyze their properties, including periodicity and asymptotes. It involves key mathematical concepts such as tangent function characteristics and transformations. GeoGebra commands like LaTeX, Sequence, and Corner are used to construct the graph, with objects like c, d, b, a, f, g, and text elements. Suitable for high school students learning trigonometric functions and graphing techniques.
GeoGebra Commands & Parameters
LaTeX(g) → text1Sequence(x = pi / ((2 * b)) + c + ((i * pi)) / b, i, (-3 * b), (3 * b), 1) → list1Corner(text3, 1) → c1Corner(text3, 2) → c2
AI Drawing Prompt Reference
Draw a graph of a tangent function, showing its periodicity and asymptotes. Include a tangent curve and text elements to label periodicity and asymptotes. The construction order is to draw the curve first, then add text labels to help understand the function's properties.
The prompt above was compiled from the original drawing commands and is for reference only.