
Graphing Sine & Cosine Functions (Amplitude & Vertical Shift Only)
Loading the math board and drawing, please wait…
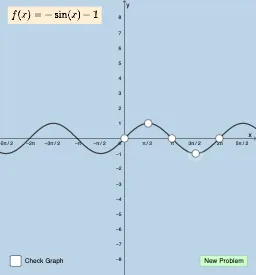
This example demonstrates the graphing of sine and cosine functions, focusing on the effects of amplitude and vertical shift on the graphs. Key math concepts include trigonometric functions, amplitude, vertical shift, and function graphing. It utilizes GeoGebra commands such as Sequence, RandomElement, Union, Point, FitSin, and Random. Suitable for high school students learning about trigonometric function transformations.
GeoGebra Commands & Parameters
Sequence(i, i, -10, 10, 1) → dlist, {-10, -9, -8, -7, -6, -5, -4, -3, -2, -1, 0, 1, 2, 3, 4, 5, 6, 7, 8, 9, 10}RandomElement(dlist) → dSequence(i, i, 1, 10, 1) → L_2, {1, 2, 3, 4, 5, 6, 7, 8, 9, 10}Sequence(i, i, -10, -1, 1) → L_1, {-10, -9, -8, -7, -6, -5, -4, -3, -2, -1}Union(L_1, L_2) → L_3RandomElement(L_3) → aPoint(x = 0) → APoint(x = π / 2) → BPoint(x = π) → CPoint(x = (2 * π)) → EPoint(x = (3 * π / 2)) → DFitSin({A, B, C, D, E}) → pRandom(1, 2) → n
AI Drawing Prompt Reference
Draw a sine function graph with random amplitude and vertical shift. First, place five key points on the x-axis at x-coordinates 0, π/2, π, 3π/2, and 2π. Then fit a smooth sine curve through these points. Additionally, randomly select a vertical shift from integers -10 to 10)Skip, and randomly select an amplitude from positive or negative integers between -10 and 10 (excluding 0). The final graph will show a sine wave that moves up or down and changes its height based on these random values.
The prompt above was compiled from the original drawing commands and is for reference only.