
Compound Interest Calculator by Baniya raz
Loading the math board and drawing, please wait…
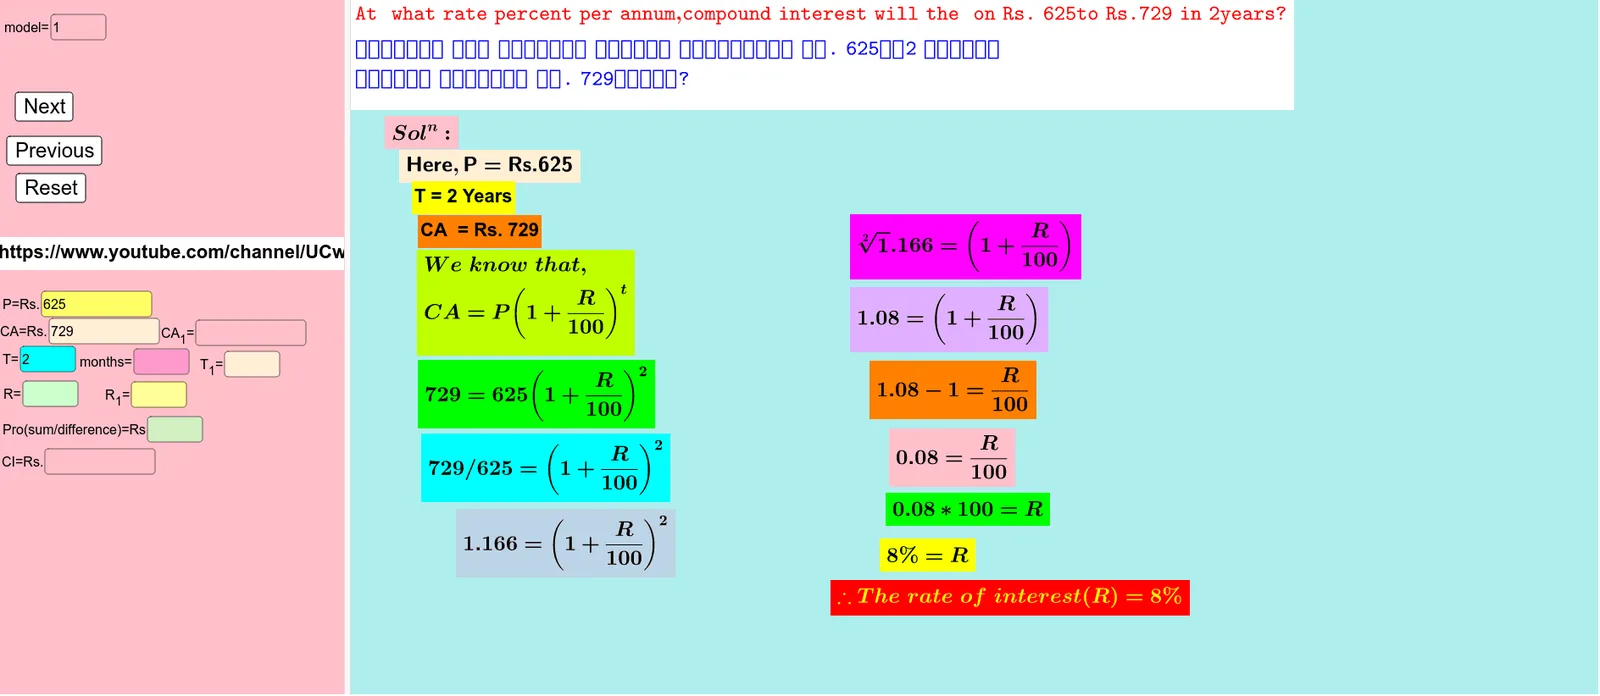
This example demonstrates the visualization of compound interest calculation and growth process. It involves core mathematical concepts like interest rate, time, principal, compound interest formula, and exponential growth. Constructed using GeoGebra commands and objects such as Textfield, CI, T, P, CA_1, CA, R, R_1, text2 to text37, InputBox, button, k, m, etc. Suitable for high school and above students to understand financial mathematics and applications of exponential functions.
GeoGebra Commands & Parameters
Textfield(P) → InputBox1Textfield(CA) → InputBox2Textfield(T) → InputBox3Textfield(m) → InputBox5Textfield(R) → InputBox6Textfield(M) → InputBox7Textfield(Pro) → InputBox8Textfield(R_1) → InputBox9Textfield(CA_1) → InputBox4Textfield(T_1) → InputBox10Textfield() → InputBox11
AI Drawing Prompt Reference
Create a visualization of compound interest calculation and growth process, including input boxes for principal, annual interest rate, investment period, and compounding frequency, and plot the compound interest growth curve to show the change in principal and interest over time, suitable for high school and above students to understand financial mathematics and exponential functions.
The prompt above was compiled from the original drawing commands and is for reference only.