
Connecting Equations to Graphs Practice (Part 1)
Loading the math board and drawing, please wait…
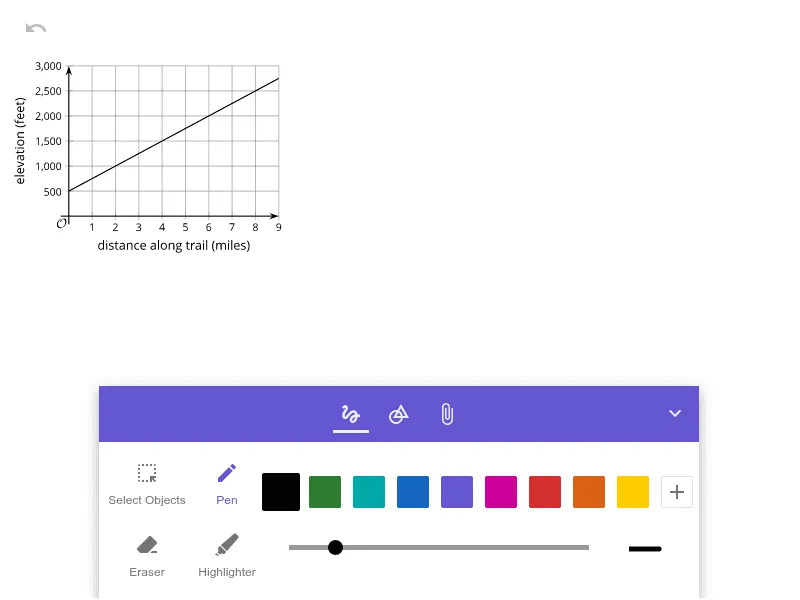
This example demonstrates how to visually connect mathematical equations to their corresponding graphs using GeoGebra. Core math concepts involved include exponents, multiplication, and trigonometry. Key construction points involve using GeoGebra command object pic1 to draw and display mathematical graphs. Suitable for middle school and above learners to understand the relationship between equations and graphs, enhancing graphical thinking and mathematical application skills.
AI Drawing Prompt Reference
Create a coordinate plane displaying multiple mathematical function graphs, including exponential, multiplicative, and trigonometric curves. Use sliders to dynamically adjust parameters, causing the graphs to update in real time. Clearly label the axes and use distinct colors for each curve to highlight the visual correspondence between equations and their graphical representations. Arrange the graphs for easy comparison, emphasizing the connection between algebraic expressions and their shapes.
The prompt above was compiled from the original drawing commands and is for reference only.