
Amplitude and Frequency
Loading the math board and drawing, please wait…
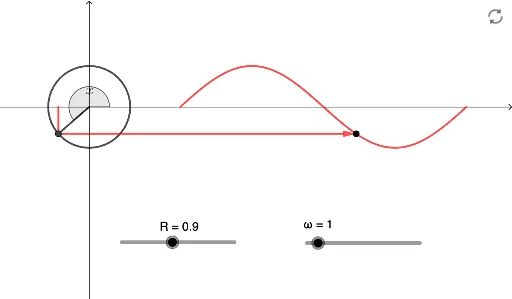
This example demonstrates the effects of amplitude and frequency on the sine wave graph. Core math concepts include amplitude, frequency, trigonometry, and coordinate geometry. It uses GeoGebra commands/objects like Circle, Vector, Translate, Segment, and Angle. Suitable for high school students learning function graph transformations.
GeoGebra Commands & Parameters
Circle((0, 0), R) → cVector((0, 0), (2, 0)) → uTranslate(f, u) → ffVector(A, P1) → vSegment((x(A), 0), A) → sAngle((100, 0), (0, 0), A) → angSegment((0, 0), A) → h
AI Drawing Prompt Reference
Draw a sine wave graph to demonstrate the effects of amplitude and frequency. Include a circle, a vector pointing to the right from the center, translate the circle along the vector, connect the center to a point on the translated circle, draw a line segment from the point to the x-axis, and form an angle by connecting the center to the point. Use sliders to adjust amplitude and frequency, showing their impact on the sine wave.
The prompt above was compiled from the original drawing commands and is for reference only.