
Function Graphing: sin(x^2/4)
Loading the math board and drawing, please wait…
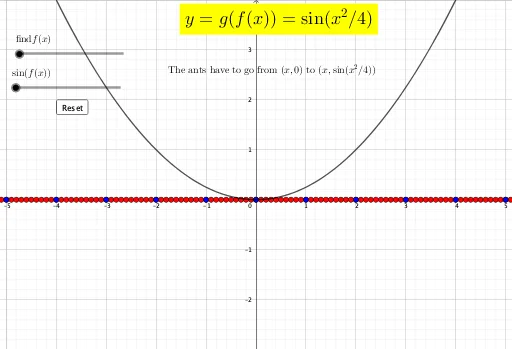
This example demonstrates how to graph the function y=sin(x^2/4) and its relationship with x^2/4. Key math concepts include function graphing, trigonometry, and analytical geometry. The construction uses GeoGebra commands like Sequence along with objects such as f, k, button1, l, text1, text6_1, xl, yt, xr, yb, g, X, Q, Z, S for function definition, parameter control, and graphical display. Suitable for high school mathematics education to understand function graphing and transformations.
GeoGebra Commands & Parameters
Sequence(-6 + (0.1 * i), i, 0, 120) → XSequence(i, i, -5, 6) → Z
AI Drawing Prompt Reference
Plot the function y=sin(x^2/4) and show how x^2/4 changes. Use a parameter to control the range of x from -6 to 6 with a step of 0.1 for x^2/4. Set the x range from -5 to 6 to observe the function graph.
The prompt above was compiled from the original drawing commands and is for reference only.