
π-Friendly Graphing Template for Sine and Cosine
Loading the math board and drawing, please wait…
In collections
Sine and Cosine Graphing Templates
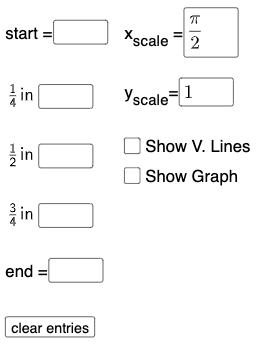
① This interactive template demonstrates sine and cosine function graphs with adjustable parameters, allowing users to visualize how changes affect the curves. ② Core math concepts include trigonometric functions (sine, cosine), function graphing, symmetry, arithmetic mean, and similar triangles, along with scatter plots and sine curve fitting. ③ Construction uses GeoGebra commands: Textfield for input boxes, Point for key points, FitSin for sine fitting, and SurdText for exact radical display; objects include multiple input boxes (InputBox1-7), points A-F, parameters a-d, function f, and text objects, enabling dynamic parameter control. ④ Suitable for high school or introductory college mathematics, this template helps explore period, amplitude, phase shift, and symmetry of trigonometric functions, and can also demonstrate data fitting and function modeling.
GeoGebra Commands & Parameters
Textfield(start) → InputBox1Textfield(end) → InputBox2Textfield(k1) → InputBox3Textfield(k2) → InputBox4Textfield(k3) → InputBox5Point(eq6) → APoint(eq7) → BPoint(eq8) → CPoint(eq9) → DTextfield(a) → InputBox6Textfield(b) → InputBox7Point(eq10) → EPoint(eq7) → FFitSin({A, C, D, E, F}) → fSurdText(k2 / π) → text1SurdText(x(A) / π) → text4SurdText(k1 / π) → text6SurdText(x(E) / π) → text8SurdText(x(F) / π) → text10
AI Drawing Prompt Reference
Create an interactive sine function graphing template with seven input boxes controlling start and end points, three coefficients, amplitude, and phase. Plot six adjustable control points on the coordinate plane and fit a sine curve through these points. Display text labels showing key coordinate values as multiples of π, such as ratios of x-coordinates and coefficients to π. The entire graph supports dynamic parameter adjustment to observe how amplitude, period, and phase shift affect the sine curve.
The prompt above was compiled from the original drawing commands and is for reference only.