
Graphing Sine & Cosine Functions: Amplitude, Period, Vertical Shift Changes Only
Loading the math board and drawing, please wait…
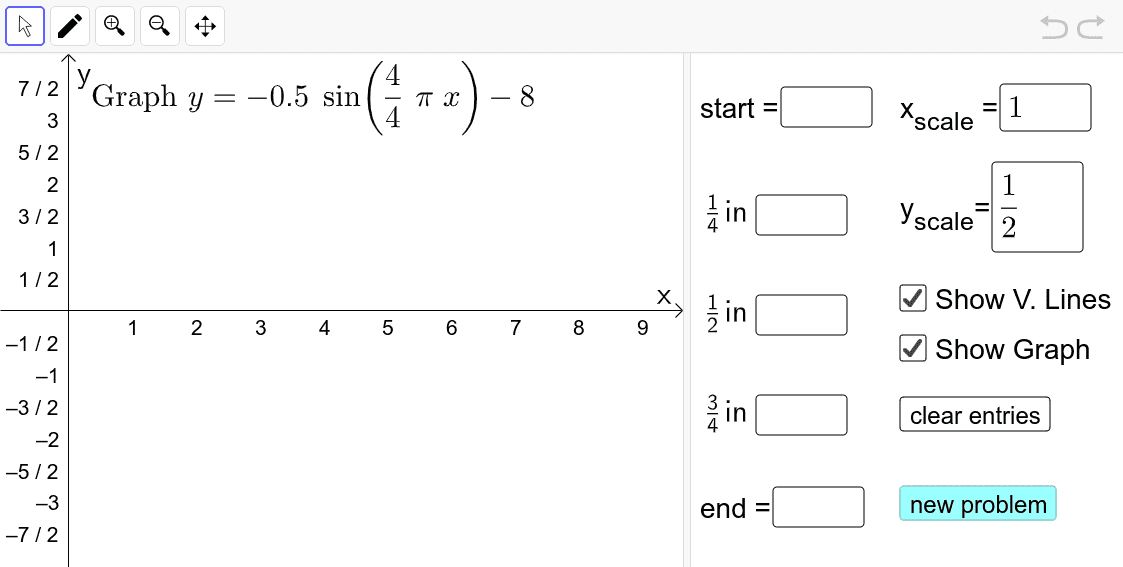
This example demonstrates how to plot sine and cosine functions, focusing on changes in amplitude, period, and vertical shift. Key mathematical concepts include trigonometric function properties, image transformations, and parameter adjustments. Construction involves GeoGebra commands like FitSin, Sequence, and RandomElement, along with points, text fields, and input boxes for interactive adjustments. Suitable for middle or high school mathematics learners to understand dynamic changes in trigonometric function graphs.
GeoGebra Commands & Parameters
Textfield(start) → InputBox1Textfield(end) → InputBox2Textfield(k1) → InputBox3Textfield(k2) → InputBox4Textfield(k3) → InputBox5Point(eq6) → APoint(eq7) → BPoint(eq8) → CPoint(eq9) → DTextfield(a) → InputBox6Textfield(b) → InputBox7Point(eq10) → EPoint(eq7) → FFitSin({A, C, D, E, F}) → fSequence(i, i, -6, -0.5, 0.5) → ampLeftList, {-6, -5.5, -5, -4.5, -4, -3.5, -3, -2.5, -2, -1.5, -1, -0.5}Sequence(i, i, 0.5, 6, 0.5) → ampRightList, {0.5, 1, 1.5, 2, 2.5, 3, 3.5, 4, 4.5, 5, 5.5, 6}Union(ampLeftList, ampRightList) → ampListRandomElement(ampList) → ampRandomElement(Sequence[i, i, -8, 8, 0.5]) → dvalRandomElement({1, 2, 3, 4, 5}) → bnumRandomElement({1, 2, 3, 4, 5}) → bdenomRandomElement({1, 2, 3, 4, 5}) → cnumRandomElement({1, 2, 3, 4, 5}) → cdenomRandom(1, 2) → ccIf(cc ≟ 1, (amp * sin(((bnum / bdenom * π) * x))) + dval, (amp * cos(((bnum * π / bdenom) * x))) + dval) → p
AI Drawing Prompt Reference
Draw a dynamic graph of a sine or cosine function with adjustable amplitude, period, and vertical shift. The main curve is generated by fitting through several key points placed on the coordinate plane. Multiple input boxes are provided to set start and end values, along with three parameters. The amplitude is randomly chosen from a set of nonzero values, the vertical shift is random between -8 and 8, and the period is determined by a random ratio of integers. The function randomly switches between sine and cosine. The graph illustrates how trigonometric functions change with parameters, suitable for educational demonstration.
The prompt above was compiled from the original drawing commands and is for reference only.