
Graphing Rational Functions with Transformations Quiz
Loading the math board and drawing, please wait…
In collections
Rational Functions
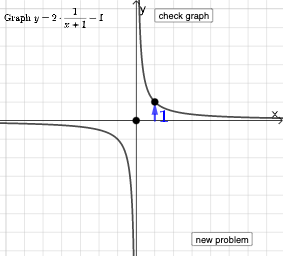
This example demonstrates how to graph rational functions with transformations. It involves core math concepts like rational functions, function graphs, and geometric transformations. Construction highlights include commands/objects like Random, RandomElement, Point, Vector, If. Suitable for high school mathematics teaching, focusing on graphing rational functions and transformation applications.
GeoGebra Commands & Parameters
Random(0, 1) → qRandomElement({-5, -4, -3, -2, -1, 0, 1, 2, 3, 4, 5}) → mRandomElement({-5, -4, -3, -2, -1, 0, 1, 2, 3, 4, 5}) → lRandomElement({2, 3, 4, 5}) → jPoint(Line[A + (1, 0), A + (1, 1)]) → CVector(A + (1, 0), C) → uIf(c, ((y(C) - y(A)) * 1 / (x - h)) + k, ((-abs(y(C) - y(A))) * 1 / (x - h)) + k) → fVector((0, 0), (x(A), 0)) → vVector((x(A), 0), A) → wIf(q ≟ 0, (j * 1 / (x - l)) + m, ((-j) * 1 / (x - l)) + m) → pIf(h ≟ l, "Horizontal shift is correct.", "Horizontal shift is not correct.") → text11If(k ≟ m, "Vertical shift is correct.", "Vertical shift is not correct.") → text12If(q ≟ 0, 1, -1) → rIf(y(C) - y(A) ≟ j, "Scale factor is correct.", "Scale factor is not correct.") → text10
AI Drawing Prompt Reference
Draw a rational function graph in the form f(x) = j / (x - l) + m, where j, l, and m are randomly generated integers. Start by creating a point A and then create a point C 1 unit to the right of A. Construct a vector u through points A and C. Next, determine the slope of the function f based on the slope of vector u and create vectors v and w on the x-axis to represent the x-axis and vector u. Finally, adjust the position and direction of the graph based on the values of j, l, and m.
The prompt above was compiled from the original drawing commands and is for reference only.