
Graphing Quadratic Equations - Homework 4 by Garret Cahill
Loading the math board and drawing, please wait…
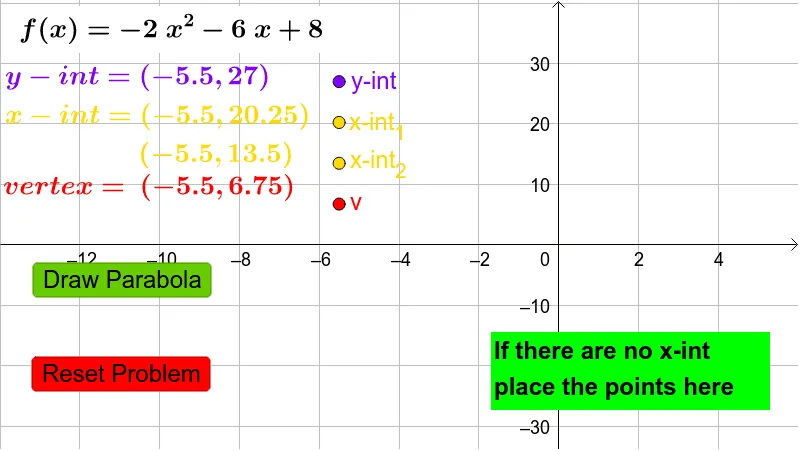
This example demonstrates how to graph quadratic equations in the form y=ax²+bx+c and explore their properties. Key mathematical concepts include: the relationship between coefficients (a, b, c) and the parabola's shape, calculating vertex coordinates h=-b/(2a) and k=c-b²/(4a), and analyzing the discriminant disc=b²-4ac to determine the number and type of roots. Construction highlights: Coefficients command extracts equation coefficients; InputBox allows users to interactively modify a, b, c values and see real-time image updates; If command with text objects provides instant answer feedback (checking x-intercepts, vertex, and y-intercept correctness). Suitable for middle school or high school mathematics homework and classroom demonstrations on quadratic functions.
GeoGebra Commands & Parameters
Coefficients(f) → CoeffTextfield(f) → InputBox1If(disc ≥ 0, h + sqrt(disc) / ((2 * Coeff(1))), 1) → x1If(disc ≥ 0, h - sqrt(disc) / ((2 * Coeff(1))), 1) → x2
AI Drawing Prompt Reference
Draw a graph of a quadratic function y=ax²+bx+c, where coefficients a, b, and c can be adjusted via an input box. The graph should show a parabola, with its vertex labeled at coordinates (h, k) where h=-b/(2a) and k=c-b²/(4a). Additionally, based on the discriminant disc=b²-4ac, if disc is non-negative, display two x-intercepts at x-coordinates h+sqrt(disc)/(2a) and h-sqrt(disc)/(2a); if disc is negative, indicate no real roots. Include coordinate axes, grid lines, and the parabola updating dynamically as coefficients change.
The prompt above was compiled from the original drawing commands and is for reference only.