
Interactive Quadratic Equation Graphing and Analysis
Loading the math board and drawing, please wait…
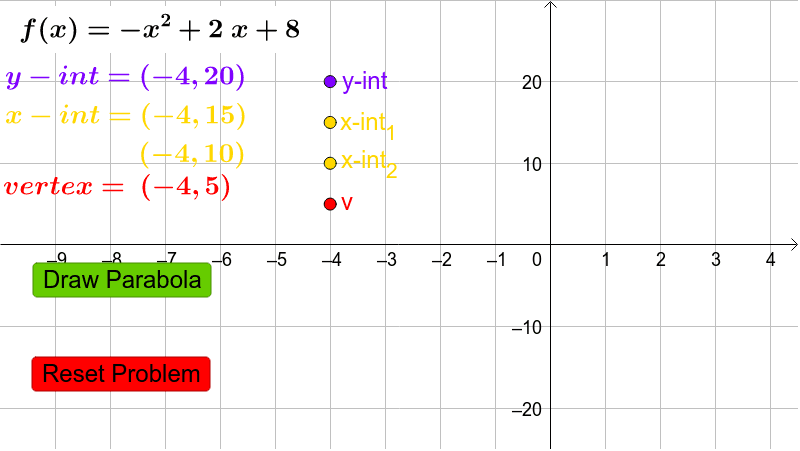
This example demonstrates graphing quadratic functions y=ax²+bx+c and analyzing their properties. Users input coefficients a, b, and c to generate the parabola, with real-time display of vertex coordinates (h,k) and discriminant Δ values. Key mathematical concepts include converting between standard and vertex forms, understanding parabola opening direction and width, the relationship between discriminant and roots, and finding maximum/minimum values. Construction uses Coefficients command to extract coefficients, InputBox for parameter input, If conditions for answer verification, and Textfield to display computed results (vertex, discriminant, x-intercepts). Buttons enable self-testing. Suitable for high school mathematics, ideal for classroom demonstrations or exam practice in quadratic functions units, helping students visualize the connection between algebraic solutions and graphical representations.
GeoGebra Commands & Parameters
Coefficients(f) → CoeffTextfield(f) → InputBox1If(disc ≥ 0, h + sqrt(disc) / ((2 * Coeff(1))), 1) → x1If(disc ≥ 0, h - sqrt(disc) / ((2 * Coeff(1))), 1) → x2
AI Drawing Prompt Reference
Create a graph of a quadratic function y=ax²+bx+c where users input coefficients a, b, c to generate the parabola. Display the vertex coordinates (h,k) and discriminant Δ in real-time. When the discriminant is non-negative, calculate and show the x-intercepts. Use input boxes for coefficient entry, text fields for displaying computed results like vertex, discriminant, and x-intercepts to analyze function properties and the relationship between the discriminant and roots.
The prompt above was compiled from the original drawing commands and is for reference only.