
Graphing Quadratic Functions - Class Example 3
Loading the math board and drawing, please wait…
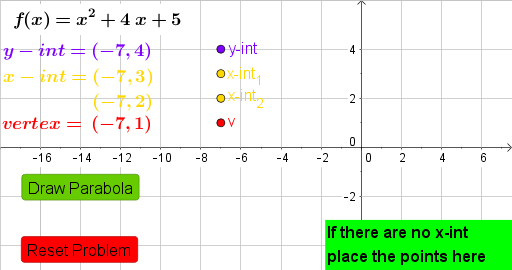
This example demonstrates how to graph quadratic functions. Key mathematical concepts include quadratic functions, vertex, intercepts, and discriminant. Using GeoGebra commands such as Coefficients, Textfield, If, etc., the coefficients of the quadratic function can be dynamically adjusted to observe changes in the graph. Suitable for middle school and above students to learn about the graph and properties of quadratic functions.
GeoGebra Commands & Parameters
Coefficients(f) → CoeffTextfield(f) → InputBox1If(disc ≥ 0, h + sqrt(disc) / ((2 * Coeff(1))), 1) → x1If(disc ≥ 0, h - sqrt(disc) / ((2 * Coeff(1))), 1) → x2
AI Drawing Prompt Reference
Draw a dynamic graph of a quadratic function, showing a parabola with an input box for its coefficients. The graph should display the vertex, x-intercepts (if they exist), and the discriminant value. As the coefficients in the input box are adjusted, the parabola's shape and position update in real time, along with the coordinates of the vertex and intercepts. Clearly label the coordinate axes and key points to observe the parabola's opening direction, axis of symmetry, and roots.
The prompt above was compiled from the original drawing commands and is for reference only.