
Graphing Quadratic Equations - Classwork Example 4
Loading the math board and drawing, please wait…
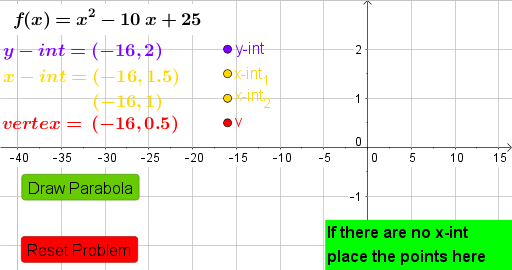
This example demonstrates how to graph quadratic functions by inputting coefficients, highlighting the vertex, axis of symmetry, and x-intercepts. Core math concepts include quadratic function standard form, vertex coordinates, discriminant, and graph characteristics. GeoGebra commands used are Coefficients, Textfield, and If; objects include f (function), Coeff (coefficients), h,k (vertex coordinates), disc (discriminant), InputBox1 (input box), A,B,C,D (parameters), text1-7 (text display), xintcorrect (x-intercept correctness), error (error prompt), vertexcorrect (vertex correctness), yintcorrect (y-intercept correctness), button1-3 (buttons), push (button action), sp (sliders), allcorrect (all correct prompt). Suitable for middle school students and above learning quadratic function graphing and parameter influence analysis, or introductory calculus education.
GeoGebra Commands & Parameters
Coefficients(f) → CoeffTextfield(f) → InputBox1If(disc ≥ 0, h + sqrt(disc) / ((2 * Coeff(1))), 1) → x1If(disc ≥ 0, h - sqrt(disc) / ((2 * Coeff(1))), 1) → x2
AI Drawing Prompt Reference
Graph a quadratic function by inputting coefficients, highlighting the vertex, axis of symmetry, and x-intercepts, and displaying the discriminant. Use buttons and sliders to adjust parameters and show the relationship between function characteristics and parameter changes.
The prompt above was compiled from the original drawing commands and is for reference only.