
Rocket Launch: Function & Height & Velocity Graph
Loading the math board and drawing, please wait…
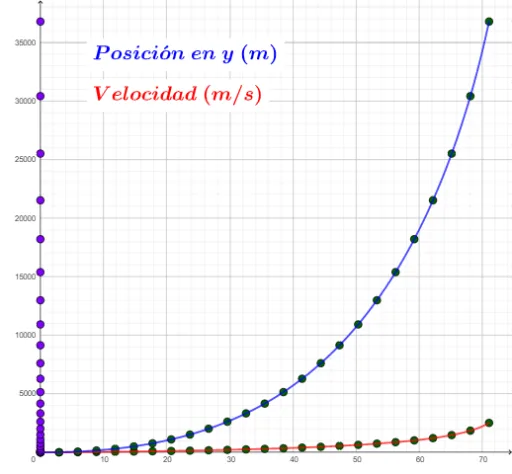
This example demonstrates the graphical representation of height and velocity changes during a rocket launch. It involves core mathematical concepts such as functions, derivatives, sequences, coordinate geometry, and calculus. Key GeoGebra commands/objects used include Derivative, Sequence, RemoveUndefined, TableText, Max, Min, PolyLine, Textfield, and LaTeX for constructing the graph. Suitable for high school and above, ideal for physics and mathematics education.
GeoGebra Commands & Parameters
Derivative(f) → f'Sequence((i, f'(i)), i, 0, floor((10 * xmaxdom)) / 10, floor((xmaxdom * 10)) / ((10 * n))) → LPvSequence((i, f(i)), i, 0, floor((xmaxdom * 10)) / 10, floor((xmaxdom * 10)) / ((10 * n))) → LPpRemoveUndefined(Sequence[y(Element[LPv, i]), i, 1, Length[LPv], 1]) → LyVRemoveUndefined(Sequence[y(Element[LPp, i]), i, 1, Length[LPp], 1]) → LyPRemoveUndefined(Sequence[x(Element[LPp, i]), i, 1, Length[LPp], 1]) → LxPRemoveUndefined(Sequence[x(Element[LPv, i]), i, 1, Length[LPv], 1]) → LxVTableText({LaTeX[f, true, true]}, {LaTeX[f', true, true]}) → text1Max({Max[LxP], Max[LxV]}) → xmaxDerivative(Expand[f]) → f'expandMin(LxP) → xminMax({Max[LyP], Max[LyV]}) → ymaxMin(LyP) → yminPolyLine(Sequence[(i, f'(i)), i, 0, xmax, 0.01]) → f'restPolyLine(Sequence[(i, f(i)), i, 0, xmax, 0.01]) → frestTextfield(v_e) → InputBox1Textfield(m_0) → InputBox2Textfield(u) → InputBox3LaTeX(xmaxdom, true, true) → text4Sequence((0, Element[LyP, i]), i, 1, Length[LyP], 1) → l1Textfield(n) → InputBox4