
Graphing Linear Inequalities in Standard Form (Quiz)
Loading the math board and drawing, please wait…
In collections
A1.ACE.1 - Create and solve equations and inequalities
Linear Inequalities
Linear Programming
Linear Inequalities in 2 Variables
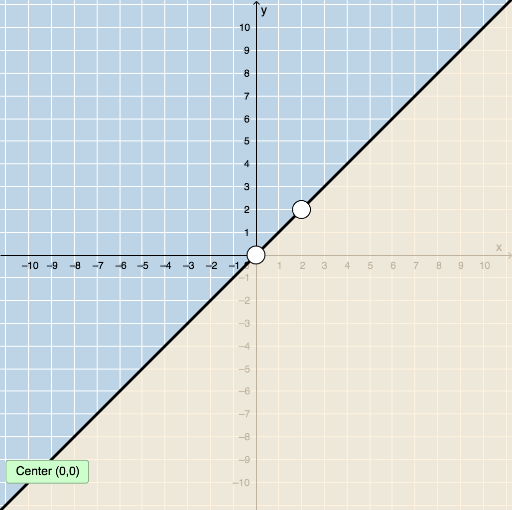
This example demonstrates how to graph linear inequalities in standard form (Ax+By+C>0 or Ax+By+C<0) with real-time feedback. Key math concepts include linear equations, inequalities, region representation, boundary lines, and special points. GeoGebra commands like Random, Sequence, Union, RandomElement, Line, and Slope are used to generate random inequalities, draw boundary lines, determine regions, and provide feedback. Suitable for high school students practicing analytical geometry and inequality graphing, or for classroom demonstrations.
GeoGebra Commands & Parameters
Random(-10, 10) → aRandom(-5, 5) → kSequence(i, i, 1, 10, 1) → brightSequence(i, i, -10, -1, 1) → bleftUnion(bleft, bright) → blistRandomElement(blist) → bRandom(1, 4) → nLine(A, B) → jLine(A, B) → lSlope(j) → p