
Graphing Linear Inequalities in 2 Variables
Loading the math board and drawing, please wait…
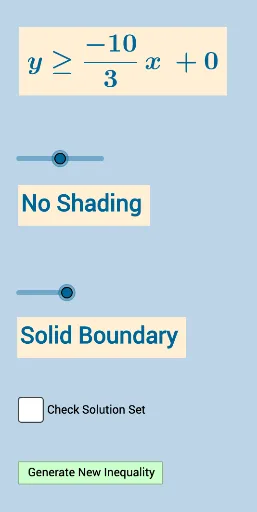
This example demonstrates how to graph linear inequalities in a 2D coordinate system. Key math concepts include inequalities, linear functions, and coordinate geometry. It utilizes GeoGebra commands and objects such as Sequence, Union, Random, Line, FractionText, and Slope for construction. Suitable for high school students learning to plot inequality graphs.
GeoGebra Commands & Parameters
Sequence(i, i, -10, -1) → aSequence(i, i, -10, -1) → bSequence(i, i, 1, 10) → cUnion(b, c) → dRandom(-10, 10) → eLine(A, B) → iFractionText(Slope[f]) → text1FractionText(f(0)) → text2Random(1, 4) → symbolLine(A, B) → hSlope(i) → slope_i