
Graphing Linear Equations by Plotting Points
Loading the math board and drawing, please wait…
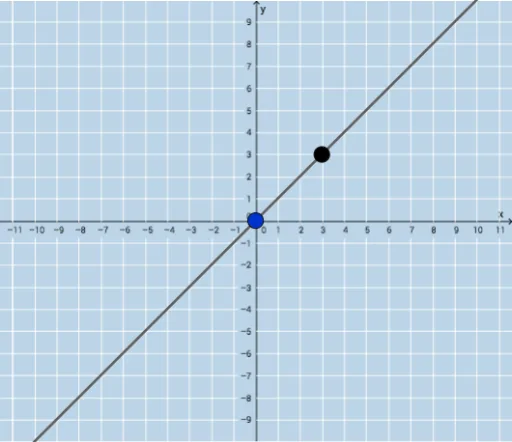
This example demonstrates how to graph linear equations using the point plotting method. Key mathematical concepts include linear equations and coordinate geometry. It utilizes commands such as Sequence, Union, Random, Point, Line, and FractionText in GeoGebra. Suitable for students in middle school and above to learn how to graph linear equations.
GeoGebra Commands & Parameters
Sequence(i, i, -10, -1) → aSequence(i, i, -10, -1) → bSequence(i, i, 1, 10) → cUnion(b, c) → dRandom(-12, 12) → ePoint(x = 0) → ALine(A, B) → gFractionText(Slope[f]) → text1FractionText(f(0)) → text2
AI Drawing Prompt Reference
Draw a line by plotting points to demonstrate the graph of a linear equation. First, generate a series of points on the x-axis and another series on the y-axis, then combine these points. Next, randomly select two points from the combined set and draw a line through them. Finally, label the slope and y-intercept of the line as fractions.
The prompt above was compiled from the original drawing commands and is for reference only.