
Graphing Linear Equations Using the Intercepts
Loading the math board and drawing, please wait…
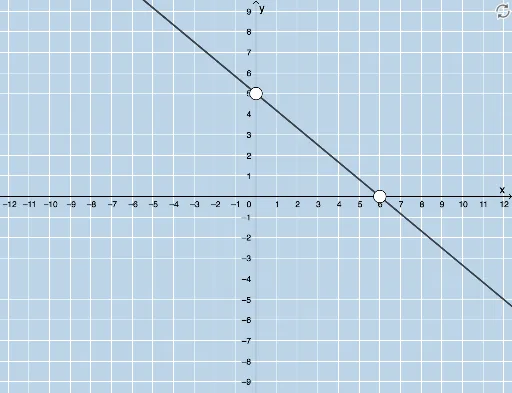
This example demonstrates how to graph a linear equation by finding its x-intercept and y-intercept, then drawing the line through these two points. The core mathematical concepts include linear equations in standard form, intercepts, and the geometric representation of a line on the coordinate plane. Construction details: GeoGebra commands such as Random, LCM, and Line are used, along with interactive buttons (button1, button2) and objects like variables a, b, c, k, d, f, points A and B, and text elements (text1, text2, text3) to dynamically illustrate the intercept method. Suitable for middle school or early high school students learning about linear functions, this interactive tool helps visualize how intercepts determine the line's position and slope.
GeoGebra Commands & Parameters
Random(-6, 6) → aRandom(-6, 6) → bLCM(a, b) → cRandom(1, 4) → kLine(A, B) → g
AI Drawing Prompt Reference
In a coordinate plane, generate two random points and draw a line through them, showing the x-axis and y-axis intercepts. Use sliders to dynamically adjust the line's position and slope, displaying the intersection points with the axes. Demonstrate dynamically how to graph the line using the intercept method with interactive buttons and text elements, explaining the standard form of the linear equation and its relation to the intercepts.
The prompt above was compiled from the original drawing commands and is for reference only.