
Graphing Inequalities on the Number Line
Loading the math board and drawing, please wait…
In collections
CCSS HS: Algebra (Reasoning with Equations & Inequalities)
CCSS HS: Algebra (Reasoning with Equations & Inequalities)
CCSS HS: Algebra (Reasoning with Equations & Inequalities)
Algebra: Linear Inequalities
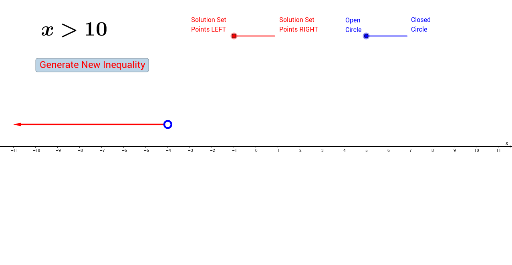
This example demonstrates how to graph basic inequalities on a number line. It involves core math concepts like inequalities and number line representation. Constructed using GeoGebra commands/objects such as Random, Point, DynamicCoordinates, and Vector. Suitable for middle school students practicing basic inequality graphing.
GeoGebra Commands & Parameters
Random(-10, 10) → aPoint(b) → ARandom(1, 4) → eRandom(0, 1) → rDynamicCoordinates(A, round(x(A)), 1) → BVector((x(B) + 0.15, 1), (11, 1)) → uVector((x(B) - 0.15, 1), (-11, 1)) → v
AI Drawing Prompt Reference
Create a simple number-line inequality diagram. First generate a random point, then round its x-coordinate to an integer and place that point on a horizontal line at height 1. From a position just to the right of this marked point, draw an arrow pointing toward the right end of the line; from a position just to the left of the marked point, draw another arrow pointing toward the left end. The two arrows should represent the directions of greater-than and less-than inequalities on the number line, with a clean layout suitable for middle-school students.
The prompt above was compiled from the original drawing commands and is for reference only.