
Graphically Solving Systems of Inequalities
Loading the math board and drawing, please wait…
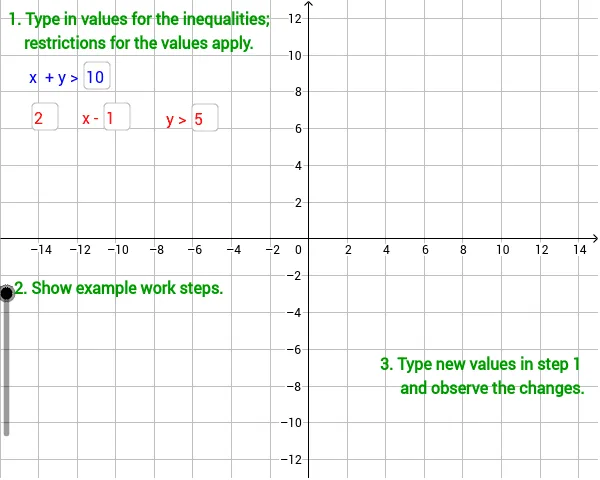
This example demonstrates how to solve a system of linear or quadratic inequalities using a graphical approach. Users input inequalities, and GeoGebra plots each inequality's region, highlighting the feasible area where all conditions are satisfied. The core mathematical concepts include the geometric interpretation of inequality solutions, region intersection, and boundary lines in coordinate geometry. The construction uses GeoGebra's Textfield and Intersect commands, creating input fields, axes, line objects (line1, ineq1, ineq2), and interactive elements (directions1, showSteps) to guide step‑by‑step exploration. It is suitable for high‑school algebra (grade 10‑12) and college introductory mathematics courses, helping students visualize the relationship between algebraic inequalities and their graphical solutions.
GeoGebra Commands & Parameters
Textfield(a) → inputATextfield(b) → inputBTextfield(c) → inputCTextfield(d) → inputDIntersect(line1, line2) → C
AI Drawing Prompt Reference
Create a graphical illustration for solving systems of inequalities. The image should feature a standard Cartesian coordinate plane with labeled x and y axes. At the top of the plane, include four text input fields for users to enter inequality expressions. Based on the inputs, draw the boundary lines or curves for each inequality, which divide the plane into distinct regions. Then, shade the solution region for each inequality and highlight their intersection, representing the feasible area where all conditions are satisfied. Finally, mark the intersection point of the boundary lines. The graph should incorporate interactive elements, such as step-by-step directions, to guide visual exploration of the geometric relationships.
The prompt above was compiled from the original drawing commands and is for reference only.