
Graphical Solution of a Linear System
Loading the math board and drawing, please wait…
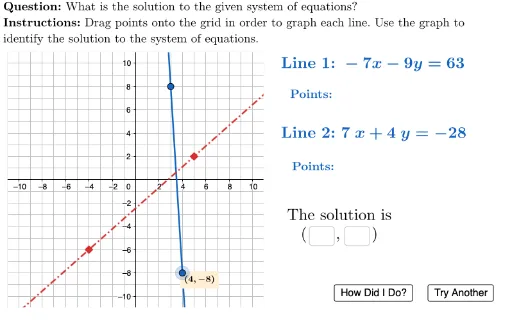
This example demonstrates solving a linear system graphically. Key mathematical concepts include the graphical representation of linear systems and their intersections. GeoGebra commands used include Point, Element, Polygon, Line, Intersect, etc. Suitable for students in middle school and above studying linear algebra and coordinate geometry.
GeoGebra Commands & Parameters
Point({userPOIx, userPOIy}) → userPOIElement(questionList, questionListIndex) → questionNumElement(C2:C5, questionNum) → poiPolygon({(-11, -11), (-11, 11), (11, 11), (11, -11)}) → viewBoxLaTeX((((("\text{" * QUESTION) * "\\") * INSTRUCTIONS) * "}")) → TEXTDynamicCoordinates(free1A, If[IsInRegion[free1A, viewBox], x(free1A), 18.5], If[IsInRegion[free1A, viewBox], y(free1A), 7.25]) → line1ADynamicCoordinates(free2A, If[IsInRegion[free2A, viewBox], x(free2A), 18.5], If[IsInRegion[free2A, viewBox], y(free2A), 1.25]) → line2ADynamicCoordinates(free2B, If[IsInRegion[free2B, viewBox], x(free2B), 20.5], If[IsInRegion[free2B, viewBox], y(free2B), 1.25]) → line2BDynamicCoordinates(free1B, If[IsInRegion[free1B, viewBox], x(free1B), 20.5], If[IsInRegion[free1B, viewBox], y(free1B), 7.25]) → line1BLine(line1A, line1B) → userLine1Line(line2A, line2B) → userLine2Intersect(A2, B2) → C2Intersect(A3, B3) → C3Intersect(A4, B4) → C4Intersect(A5, B5) → C5Element(A2:A5, questionNum) → line1Element(B2:B5, questionNum) → line2LaTeX(("\text{Line 1: }" * line1)) → labelLine1LaTeX(("\text{Line 2: }" * line2)) → labelLine2LaTeX("\text{Points: }") → pointsLine1LaTeX("\text{Points: }") → pointsLine2Textfield(textPOIx) → ansBoxXTextfield(textPOIy) → ansBoxYLaTeX("\begin{tabular}{c}\text{The solution is}\\(\hspace{45},\hspace{45})\end{tabular}") → solutionLaTeX(activePoint) → activePointLabelLaTeX(poi) → poiLabelLaTeX("\text{Line 1}") → line1LabelOnGridLaTeX("\text{Line 2}") → line2LabelOnGrid
AI Drawing Prompt Reference
Draw two lines within a coordinate grid and mark their intersection point. First, create a bounding box within the coordinate system, then draw two lines that can be dynamically adjusted to stay inside the box. Next, find the intersection point of the two lines and highlight it with a distinct color or marker. Finally, add text labels to indicate the equations of the lines and the coordinates of the intersection point.
The prompt above was compiled from the original drawing commands and is for reference only.