
Graphical Relationship Between a Function and Its Derivative
Loading the math board and drawing, please wait…
In collections
BC Calculus
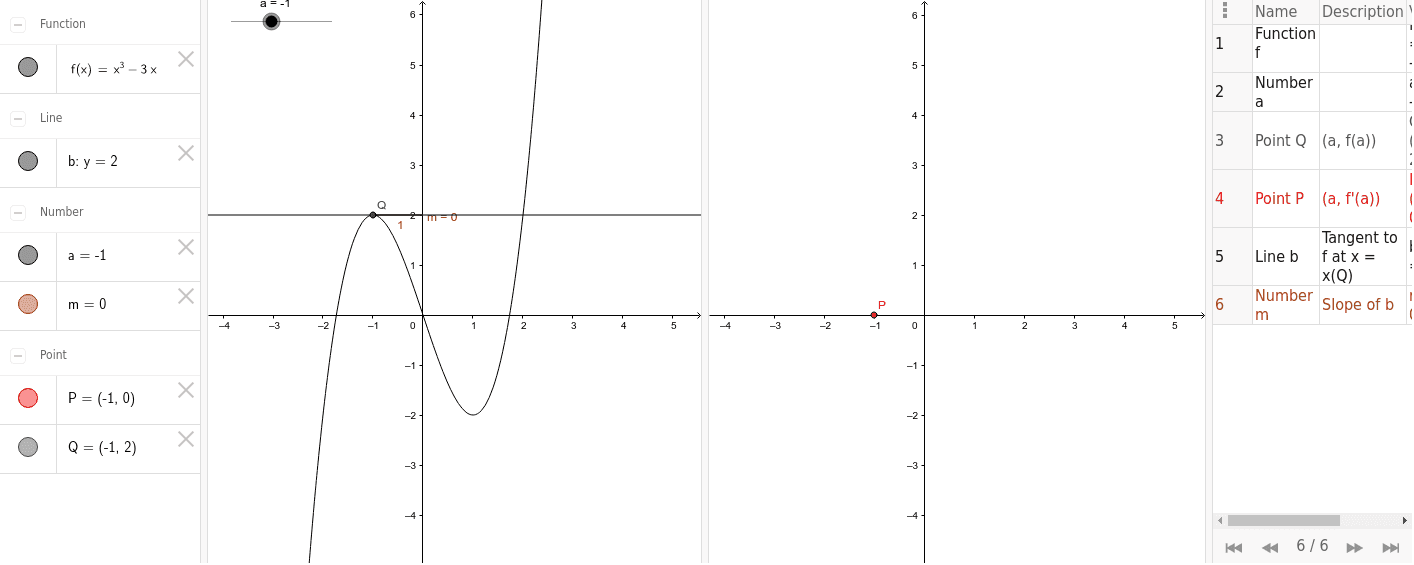
This example demonstrates how to plot the graph of a function f(x) = x^3 - 3x and its derivative (slopes of tangent lines) on separate graphs. Key math concepts include functions, derivatives, tangent slopes, and coordinate geometry. It uses GeoGebra commands Tangent and Slope with objects f, a, Q, P, b, m. Suitable for high school students learning calculus to visually understand the relationship between a function and its derivative.
GeoGebra Commands & Parameters
Tangent(Q, f) → bSlope(b) → m
AI Drawing Prompt Reference
Plot the graph of the function f(x) = x^3 - 3x and its derivative, which represents the slope of tangent lines at various points on the function's graph. First, draw the function's graph, then mark several key points on it and draw tangent lines through these points, finally labeling the slope values of the tangent lines to demonstrate the relationship between the function and its derivative.
The prompt above was compiled from the original drawing commands and is for reference only.