
Graphical Limits: Visualizing Function Behavior
Loading the math board and drawing, please wait…
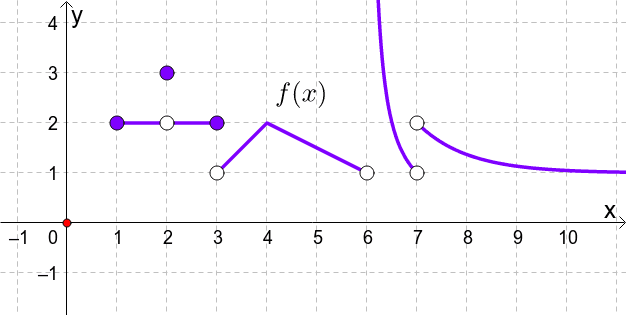
①This applet demonstrates the concept of limits graphically, showing how a function's value approaches a target as the input nears a specific point. ②The core mathematical concept is the limit, including one-sided limits and the existence of a limit value. ③Construction details: Using GeoGebra commands Point and Vector, objects A, B, C, D, vectors u and v are created, along with auxiliary points C_1, B_1 through B_4, the function f, and a text label text1. These elements visually track the approach of points toward a limit. ④Suitable for high school seniors or early college calculus students, this interactive tool aids in classroom demonstrations or self-study, helping learners grasp the intuitive meaning of limits before formal definitions.
GeoGebra Commands & Parameters
Point(xAxis) → DVector((x(D), 0), (x(D), f(x(D)))) → uVector((x(D), f(x(D))), (0, f(x(D)))) → v
AI Drawing Prompt Reference
Draw a function curve on a coordinate plane. Place a movable point on the x-axis. From this point, draw a vertical segment upward to the point on the curve directly above it. Then from that curve point, draw a horizontal segment leftward to the y-axis. These two segments form a right-angle path that visually shows how the function value approaches a limit as the x-coordinate nears a target. Include the axes, the curve, and the moving point to illustrate the approach behavior.
The prompt above was compiled from the original drawing commands and is for reference only.