
One-Sided Limits Dynamic Visualization
Loading the math board and drawing, please wait…
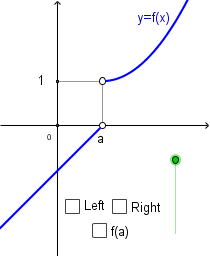
This GeoGebra example dynamically visualizes the concepts of left-hand and right-hand limits of a function at a point. It demonstrates how the function approaches different values from the two sides, and clarifies when a two-sided limit does not exist. Core mathematical concepts include one-sided limits, limit existence, and the distinction between the limit value and the function value at the point. The construction uses commands such as Function, Point, Segment, Intersect, Ray, and Vector to build auxiliary points, segments, rays, and vectors, along with multiple text objects (text1 to text13) to label limit values, function values, and directional arrows. Additional elements like ellipses, pie charts, and planes are included for visual context. This is suitable for high school seniors or early university calculus students to gain an intuitive grasp of one-sided limits and their role in determining overall limit existence.
GeoGebra Commands & Parameters
Function(x - 1, -3, 1) → fPoint(f) → AFunction((x - 1)^(2) / 2 + n, 1, 3.5) → gPoint(g) → BPoint(yAxis) → CSegment(C, D) → aSegment(B, A) → bSegment(D, A) → cSegment(E, B) → dIntersect(xAxis, yAxis) → FRay(A, F) → ePoint(xAxis) → GRay(A, G) → hPoint(e) → HPoint(h) → ISegment(H, J) → iSegment(I, K) → jVector(J, L) → uVector(K, M) → v