
Graph of y = a / x
Loading the math board and drawing, please wait…
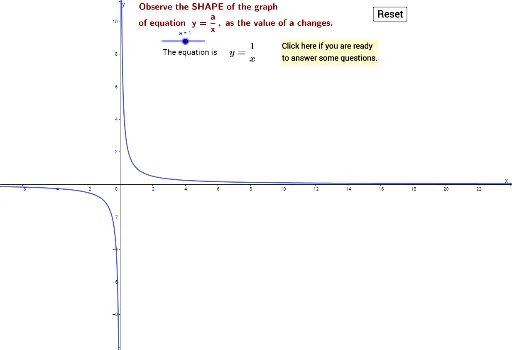
This example demonstrates the graph of the inverse proportion function y = a / x. It involves the core mathematical concept of the properties of inverse proportion functions. By using GeoGebra commands such as If, Join, Point, etc., you can dynamically change the value of parameter a and observe the changes in the graph.
GeoGebra Commands & Parameters
If(qcount < 3, Shuffle[First[listA0, 2]], Shuffle[Last[listA0, 2]]) → listA0ShuffledJoin({{"Select :"}, listA0Shuffled}) → listA1If(Element[listA1, SelectedIndex[listA1]] ≟ Element[listA0, qcount], true, false) → answercorrectPoint(c) → A