
Ghost Function or Paranormal Distribution
Loading the math board and drawing, please wait…
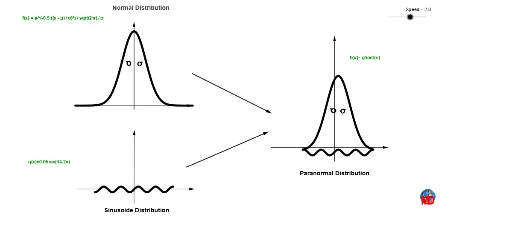
This example demonstrates the concept of a ghost function or paranormal distribution. It involves the theory of distributions in probability and statistics. Using GeoGebra commands such as rotation, point, vector, and function, complex distribution graphs can be constructed. Suitable for high school and above students or teachers.
GeoGebra Commands & Parameters
Rotate(V, t, C) → WPoint(f) → AVector(A, B) → uTranslate(f, u) → f_1Vector(D, W) → vFunction((0.05 * sin((14.2 * x))) + y(D), -1, 1) → gTranslate(g, v) → g_1Intersect(f, xAxis, (-5.798101339811831, 1.0282681594218203E-81)) → EIntersect(f, xAxis, (-11.37298342705406, 1.115862391977E-312)) → FVector(G, H) → wPoint(yAxis) → IPoint(yAxis) → JVector(I, J) → zFunction(f, -1.5, 1.5) → qVector(L, M) → bLine(C, xAxis) → cVector(N, O) → dVector(Q, S) → iVector(T, U) → jVector(D - (0, 0.25), K) → aVector(P - (0, 0.25), R) → eSegment(J, I) → kFunction(g_1, x(W) - 0.8, x(W) + 1) → hFunction(f_1, x(W) - 0.8, x(W) + 1) → p