
Geometric Longest/Shortest Lengths via Sums and Riemann Ideas
Loading the math board and drawing, please wait…
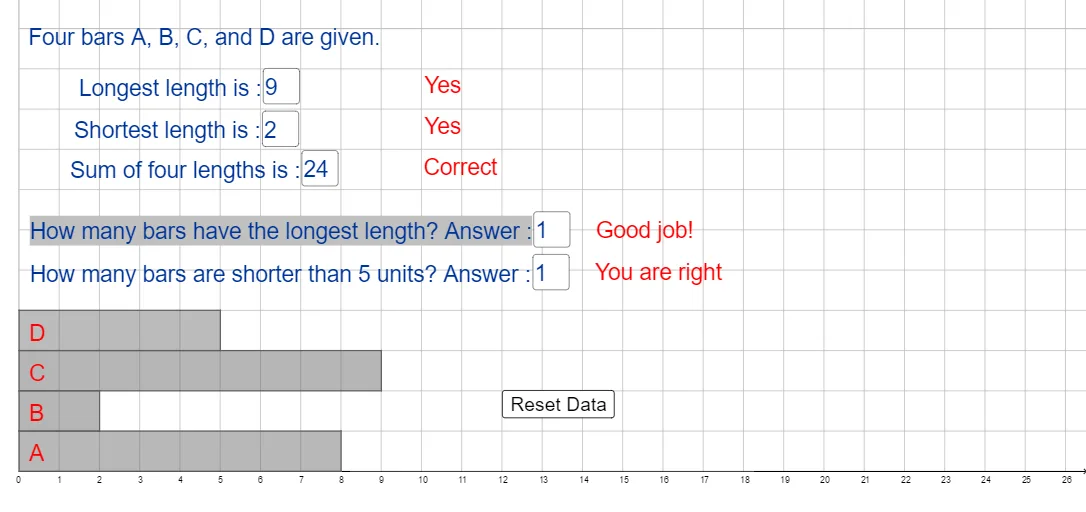
This example visualizes how the longest and shortest lengths emerge from a geometric construction involving intersecting segments and a polygonal setup. It connects the max/min of lengths with a summation process that mirrors upper and lower sum (Riemann-sum style) reasoning. The core concepts are geometric optimization (maximum/minimum distance) and summation over partitioned intervals to compare different “sum envelopes.” Construction-wise, it uses GeoGebra commands such as Polygon to create and connect geometric objects (e.g., points like a, b, c, d grouped via a set), Random to vary the configuration, Min/Max to compute the smallest and largest relevant lengths, and Sum to accumulate the segment-wise quantities. CountIf is used to tally cases meeting a condition, while Textfield and text/button objects (e.g., button1 and text labels like text1–text4) display computed values and counts (such as L, S, Lcount, Scount, and their answers) interactively. Suitable for high school advanced levels and early calculus/geometry teaching to build intuition for optimization and Riemann-sum comparisons.
GeoGebra Commands & Parameters
Random(1, 10) → aRandom(1, 10) → dRandom(1, 10) → cRandom(1, 10) → bPolygon((0, 0), (a, 0), (a, 1), (0, 1)) → A, f, g, h, iPolygon((0, 1), (b, 1), (b, 2), (0, 2)) → B, j, k, l, mPolygon((0, 2), (c, 2), (c, 3), (0, 3)) → C, n, p, q, rPolygon((0, 3), (d, 3), (d, 4), (0, 4)) → D, s, t, e, f_1Min(Set) → SSum({a, b, c, d}) → SumMax(Set) → LCountIf(x ≟ L, Set) → LcountCountIf(x < 5, Set) → ScountTextfield(Lans) → InputBox1Textfield(Sans) → InputBox2Textfield(Sumans) → InputBox3Textfield(Lcountans) → InputBox4Textfield(Scountans) → InputBox5
AI Drawing Prompt Reference
Create a grid of four rectangles with their bases on the x-axis and increasing heights. Use the vertices of these rectangles to calculate the lengths of the shortest and longest paths, as well as the number of paths that meet specific conditions. Finally, display the lengths of these paths and the number of paths that meet the conditions.
The prompt above was compiled from the original drawing commands and is for reference only.