
Geometric Art from a Segmented Curve
Loading the math board and drawing, please wait…
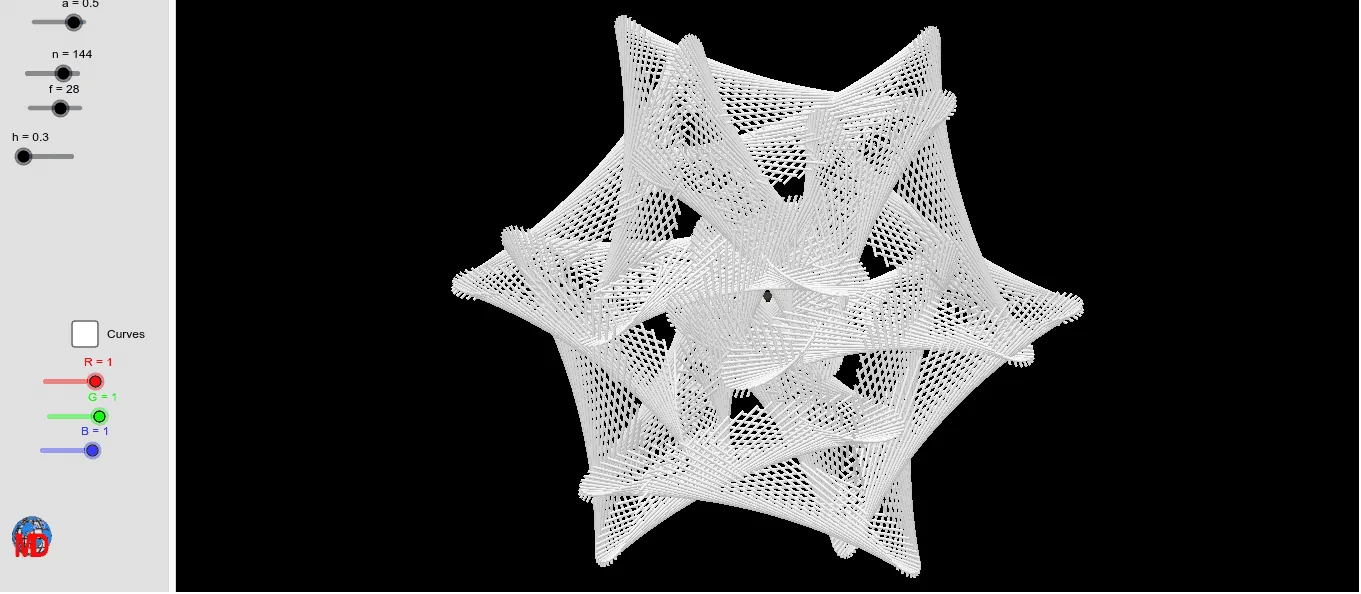
This example produces an “art-like” visualization by constructing a segmented, parameter-driven curve and combining it with geometric constraints. It demonstrates how piecewise/conditional segmentation and parameter sampling can shape a visually structured curve and related graphic elements. Key mathematics includes functions and sequences (Function, Sequence), parameterized curve construction, the use of circular/ellipse-related components, and organizing geometry through vector-like relationships and parallelogram/shape logic implied by the constructed objects. From the construction summary, the figure is built using Function and Sequence to define core parameters and generate point/parameter lists (h, a, A, theta, n, r, R_{1}); lists such as liste1, liste2, liste1b, and liste3 are used to store sampled data for different segments. Additional objects like f, l1, c, and the channels R, G, B, along with image1, indicate that the segmented curve data are mapped to visual attributes to render the final artwork. Suitable for high school through early university users, especially for lessons and projects on parametric curves, piecewise construction, and GeoGebra-based mathematical visualization.
GeoGebra Commands & Parameters
Function((4 * cos((2 * x))), 0, theta) → rSequence((x(A) + (a * cos(t)) + (0.5 * cos((7 * t))) + (1 / 3 * cos(((-1 * 17) * t) + 3.142 / 2)), y(A) + (a * sin(t)) + (0.5 * sin((7 * t))) + (1 / 3 * sin(((-1 * 17) * t) + 3.142 / 2)), z(A) + (h * sin((7 * t)))), t, 0, theta, 1 / n) → liste1Sequence(Segment[Element[liste1, i], Element[liste1, i + 1]], i, 0, theta / (1 / n)) → liste2Sequence((x(A) + (a * cos(t)) + (0.5 * cos((7 * t))) + (1 / 3 * cos(((-1 * 17) * t) + 3.142 / 2)), y(A) + (a * sin(t)) + (0.5 * sin((7 * t))) + (1 / 3 * sin(((-1 * 17) * t) + 3.142 / 2)), z(A) - (h * sin((7 * t)))), t, 0, theta, 1 / n) → liste1bSequence(Segment[Element[liste1, i], Element[liste1b, i + f]], i, 0, theta / (1 / n)) → liste3Sequence(Segment[Element[liste1b, i], Element[liste1b, i + 1]], i, 0, theta / (1 / n)) → l1
AI Drawing Prompt Reference
Create a parameter-driven segmented curve by generating core parameters with functions and sequences, then construct the curve using parameter sampling and geometric constraints. First, draw a parametric circular function, then use sequences to generate point lists, and finally create segmented curves from these point lists, mapping them to color channels to form the final artwork.
The prompt above was compiled from the original drawing commands and is for reference only.