
GeoGebra Systems of Linear Equations Exploration by Tim Brzezinski
Loading the math board and drawing, please wait…
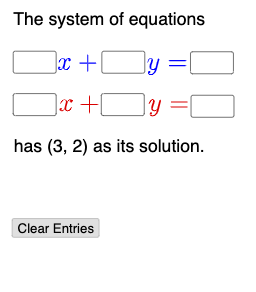
This example demonstrates the relationship between linear equation sets and their graphs through interactive exploration. Key math concepts include linear equations, function graphs, coordinate geometry, and systems of equations solving. It uses GeoGebra commands like Textfield, Mode, If, and objects such as InputBoxes and line objects (l1, l2) for construction. Suitable for high school mathematics teaching to understand the correspondence between graph intersections and solutions of linear systems.
GeoGebra Commands & Parameters
Textfield(a) → InputBox1Textfield(b) → InputBox2Textfield(c) → InputBox3Textfield(d) → InputBox4Textfield(e) → InputBox5Textfield(f) → InputBox6Textfield(g) → InputBox7Textfield(h) → InputBox8Textfield(i) → InputBox9Textfield(j) → InputBox10Mode(l1) → l2If(Length[l2] ≟ 0, "No digits repeat.", "Repeated digits exist.") → text2
AI Drawing Prompt Reference
Create an interactive graph to demonstrate the relationship between systems of linear equations and their graphs. Input coefficients to draw two lines, and mark the intersection point as the solution. Use sliders and text boxes to display conditions for inequalities and repeated digits, showing text prompts based on conditions, finally presenting the correspondence between solutions of the equation system and the intersection points of the graphs.
The prompt above was compiled from the original drawing commands and is for reference only.