
GeoGebra Simulation of Coin-Toss Probability
Loading the math board and drawing, please wait…
In collections
중2 확률 탐구
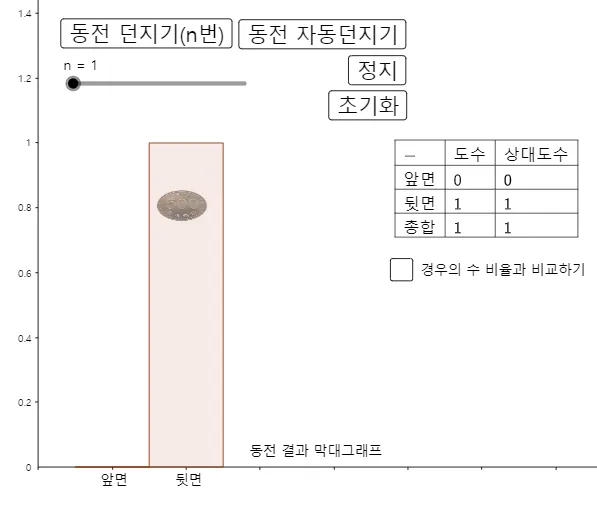
This example demonstrates how coin-toss outcomes change under repeated trials by visualizing the evolving frequencies and the resulting empirical distribution. It focuses on key probability & statistics ideas: random experiments, sample frequency, and how an empirical distribution (Bernoulli-like outcomes) can be observed through repeated simulation. Construction-wise, GeoGebra uses Random to generate coin results, Element to build and manage the results list, Frequency to count occurrences, and Histogram to display those counts as a chart. TableText is used to present summary statistics in a table, while controls such as buttons and the parameter n (number of trials) update the simulation and graphics dynamically. Suitable for middle/high school probability lessons and for exploratory activities on “frequency tends to stabilize with larger samples.”
GeoGebra Commands & Parameters
Random(1, 2) → 동전결과LaTeX(동전결과, true, true) → 텍스트4LaTeX(동전결과, true, true) → 텍스트5Line(G, xAxis) → fFrequency(계급, 동전결과리스트) → L_2Length(동전결과리스트) → 동전결과개수Histogram(계급, 동전결과리스트, true, 1 / 동전결과개수) → cElement(동전결과리스트, 동전결과개수) → aElement(L_2, 1) → B2Element(L_2, 2) → B3TableText({{A1, B1, C1}, {A2, B2, C2}, {A3, B3, C3}, {A4, B4, C4}}, "|_lll") → 텍스트1
AI Drawing Prompt Reference
Create a dynamic statistical chart simulating coin-toss probability. The main graphic is a histogram with two bins (heads and tails) on the x-axis and relative frequency on the y-axis, where bar heights update with each trial. Beside it, a table displays the number of trials, counts for heads and tails, and their frequencies. Include a slider or input field to adjust the number of trials (n) and a button to restart the simulation. Each click generates a new random sequence of coin outcomes, updating the histogram and table in real time, illustrating how frequencies stabilize around 0.5 as n increases.
The prompt above was compiled from the original drawing commands and is for reference only.