
GeoGebra AR: Building Solids with Various Cross Sections via Prism Stacking
Loading the math board and drawing, please wait…
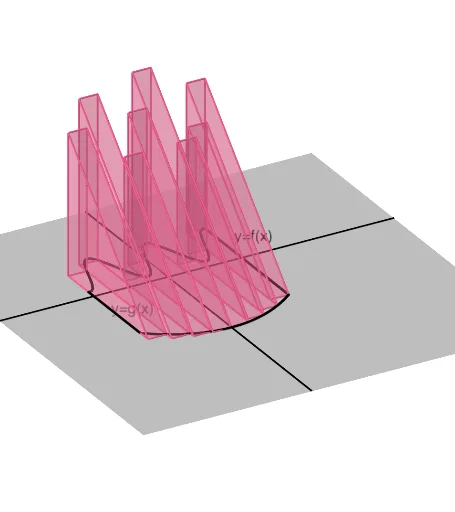
This GeoGebra example demonstrates how to create solids with various cross-sectional shapes through prism stacking in GeoGebra Augmented Reality and 3D Graphing Calculator. Core mathematical concepts include: definite integrals for volume calculation, cross-section properties of planes and solids, and spatial geometry construction. Construction highlights: Using GeoGebra 3D commands including Plane, Polygon, Segment, Sequence, Sphere, Intersect, Midpoint to build dynamic and modifiable solid models, with sliders controlling parameters like n, s, b, a for parametric adjustment. Suitable for higher mathematics (applications of definite integrals), solid geometry teaching, and AR-enhanced mathematics education, demonstrating the relationship between cross-sectional area changes and volume.
GeoGebra Commands & Parameters
Plane((0, 0, 0), (0, 1, 0), (0, 1, 1)) → sPlane((a, 0, 0), (a, 1, 1), (a, 1, 2)) → cPlane((b, 0, 0), (b, 1, 1), (b, 1, 2)) → dSegment((a, f(a)), (a, g(a))) → hSegment((b, f(b)), (b, g(b))) → iIntersect(f, h) → AIntersect(g, h, (-8, -6.968074739870145)) → BIntersect(f, i) → CIntersect(g, i, (8, -1.0319252601298547)) → DPolygon(A, B, (x(B), y(B), h), (x(A), y(A), h)) → q1, a_1, b_1, t, f_1Polygon(A, B, (a, (0.5 * (y(A) + y(B))), (sqrt(3) * h / 2))) → t1, g_1, a_2, b_2Midpoint(A, B) → ESphere(E, A) → uSequence(Polygon[(a + (i * deltax), g(a + (i * deltax)), 0), (a + (i * deltax), f(a + (i * deltax)), 0), 4, s], i, 0, n - 1, 1) → L3Polygon(A, B, (x(B), y(B), h)) → t2, k, a_3, b_3Sequence(Polygon[(a + (i * deltax), g(a + (i * deltax)), 0), (a + (i * deltax), f(a + (i * deltax)), 0), 3, s], i, 0, n - 1, 1) → L4Sequence(Polygon[(a + (i * deltax), f(a + (i * deltax)), 0), (a + (i * deltax), g(a + (i * deltax)), 0), (a + (i * deltax), g(a + (i * deltax)), Distance[(a + (i * deltax), f(a + (i * deltax)), 0), (a + (i * deltax), g(a + (i * deltax)), 0)])], i, 0, n - 1, 1) → L7Line((0, 0, 0), (1, 0, 0)) → mLine((0, 0, 0), (0, 1, 0)) → rTextfield(f) → InputBox1Textfield(g) → InputBox2Textfield(a) → InputBox3Textfield(b) → InputBox4Textfield(n) → InputBox5Sequence(Prism[Element[L3, i], deltax], i, 1, n, 1) → L2Sequence(Prism[Element[L4, i], deltax], i, 1, n, 1) → L5Sequence(Polygon[(a + (i * deltax), g(a + (i * deltax)), 0), (a + (i * deltax), f(a + (i * deltax)), 0), 5, s], i, 0, n - 1, 1) → L6Sequence(Prism[Element[L6, i], deltax], i, 1, n, 1) → L8Sequence(Midpoint[(a + (i * deltax), f(a + (i * deltax)), 0), (a + (i * deltax), g(a + (i * deltax)), 0)], i, 0, n - 1, 1) → L9Sequence((a + (i * deltax), f(a + (i * deltax)), 0), i, 0, n - 1, 1) → L10Sequence(Segment[Element[L9, i], Element[L10, i]], i, 1, n, 1) → radiiSequence((a + (i * deltax), g(a + (i * deltax)), 0), i, 0, n - 1, 1) → L11Sequence(Midpoint[Element[L10, i], Element[L11, i]], i, 1, n, 1) → L12Sequence(CircleArc[Element[L12, i], Element[L10, i], Element[L11, i], s], i, 1, n, 1) → L13Sequence(Prism[Element[L7, i], (-deltax)], i, 1, n, 1) → L
AI Drawing Prompt Reference
Construct a 3D solid in space by stacking a series of prisms along the x-axis between two function curves. Use sliders to adjust interval endpoints, number of segments, and cross-section shape parameters, dynamically showing how different cross-sections (rectangle, triangle, pentagon, semicircle, etc.) change along x, approximating volume via integration. Include two reference planes, segments connecting corresponding points on the curves, multiple polygon cross-sections generated from these segments, and a sequence of prisms equally spaced along x. Also display midpoints of cross-section bases, radius segments, and circular arcs to illustrate geometric relationships. The model is interactive, rotatable, and zoomable, visually demonstrating the definite integral's volume application.
The prompt above was compiled from the original drawing commands and is for reference only.