
Garden Stroll with Random Experiments
Loading the math board and drawing, please wait…
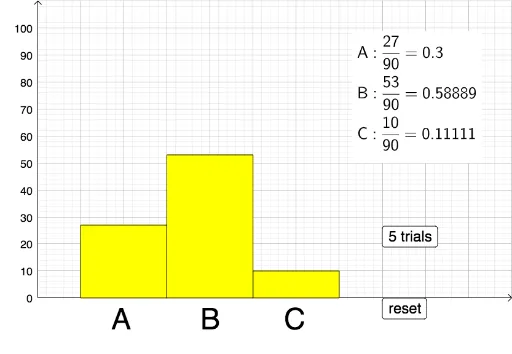
This example demonstrates conditional probability in probability statistics through random experiments. It uses the RandomElement command to simulate random events and displays the results using bar charts and dot plots. The example involves random variables, probability statistics, and random processes. By understanding the commands used, such as RandomElement, If, CountIf, etc., from the construction summary, one can grasp its construction process. Suitable for high school mathematics education and learning probability statistics concepts.
GeoGebra Commands & Parameters
RandomElement({"A", "B"}) → leftchoiceRandomElement({"A", "B", "C"}) → rightchoiceRandomElement({"L", "S", "R"}) → firstchoiceIf(firstchoice ≟ "R", rightchoice, If[firstchoice ≟ "L", leftchoice, "B"]) → text1CountIf(x ≟ "A", data) → aCountIf(x ≟ "C", data) → cLength(data) → dBarChart(data, 1) → eDotPlot(data, false) → l1BarChart(data, 1) → fCountIf(x ≟ "B", data) → b
AI Drawing Prompt Reference
Display a probability statistics random experiment example, where three options (left, right, random direction) are randomly selected to generate a result (left option, right option, or B), and the distribution of results is shown using bar charts and dot plots, with the bar chart drawn twice and the dot plot without connecting lines, ensuring the data accurately reflects randomness.
The prompt above was compiled from the original drawing commands and is for reference only.