
Functions Relation Square Notice & Wonder
Loading the math board and drawing, please wait…
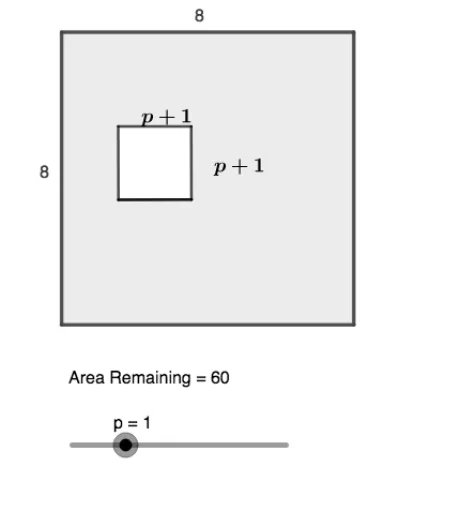
This example demonstrates the relationship between functions and square graphics through interactive visuals. Key math concepts include functions, squares, coordinate geometry, scatter plots, and correlation. Construction highlights involve GeoGebra commands like Intersect, Point, Polygon, PointIn, Sequence, Segment, and Midpoint. Suitable for high school mathematics education to understand the interaction between function graphs and geometric shapes, as well as data analysis.
GeoGebra Commands & Parameters
Intersect(xAxis, yAxis) → APoint(xAxis) → BPolygon(A, B, 4) → poly1, f, g, h, i, C, DPolygon(A, P, Q, R) → q1, a_1, p_2, q_1, r_1PointIn(q1) → ESequence((n, p_1(n)), n, -1, 7) → L_1Point(Circle[E, p + 1]) → KSegment(E, K) → qPolygon(E, K, 4) → poly2, r, s, t, a, L, MMidpoint(M, L) → GMidpoint(L, K) → H
AI Drawing Prompt Reference
Draw a coordinate system with intersecting x and y axes, create a square centered at the intersection, randomly select points on the square, connect these points to the midpoints of the square's sides to form new geometric shapes, and display the relationship between these points and the square to illustrate the connection between functions and geometric figures.
The prompt above was compiled from the original drawing commands and is for reference only.