
Function Transformation Lesson
Loading the math board and drawing, please wait…
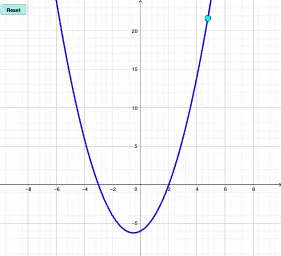
This example demonstrates transformations of function graphs including translations, scalings, and reflections. It involves core math concepts like function transformations, quadratic functions, cosine, tangent functions, limits, and geometric mean. Constructed using GeoGebra commands and objects such as Point, Polygon, Vector, Textfield, Simplify, If, Min, Max. Suitable for high school mathematics teaching and learning function transformations.
GeoGebra Commands & Parameters
Point(h) → EPoint(h) → BPolygon(B, C, D, E) → q1, b_1, c_1, d_1, eVector(A) → vTextfield(f) → InputBox2Textfield(a) → InputBox3Textfield(d) → InputBox4Textfield(b) → InputBox5Simplify(g) → rTextfield(c) → InputBox1If(k ≟ 1, r((-x)), If[l ≟ 1, (-r(x)), If[k ≟ 0 ∧ l ≟ 0, r(x), If[k ≟ 1 ∧ l ≟ 1, (-r((-x)))]]]) → sMin(y(Min[s, -5, 5]) - 3, -5) → Y_{min}Max(y(Max[s, -5, 5]), 15) → Y_{max}
AI Drawing Prompt Reference
Draw a function transformation example showing translations, scalings, and reflections. Include graphs of a quadratic function, cosine, and tangent functions along with their transformations. Use points, polygons, vectors, and text fields to label expressions and parameters. Start with the base function graphs, apply transformations based on input parameters, and finalize the display range of the graphs.
The prompt above was compiled from the original drawing commands and is for reference only.