
Area Under the Curve Using Rectangles: Upper and Lower Sums
Loading the math board and drawing, please wait…
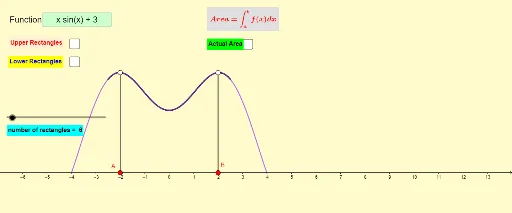
① This interactive applet visualizes how the area under a function curve can be approximated by rectangles, allowing users to enter any function and drag points A and B to adjust the integration interval. ② The core mathematical concepts are the definite integral, Riemann sums (upper and lower sums), and the limit process that leads to exact area. ③ Built with GeoGebra commands including Segment, UpperSum, LowerSum, Point, Integral, and Textfield, the construction uses objects such as function f, endpoints a and b, draggable points A/B, rectangle count n, upper/lower sum curves g and h, integral value p, and multiple text/input boxes for interactive control. ④ Suitable for high school and early college calculus instruction, this applet helps students grasp the geometric meaning of integration, observe how approximation error changes with rectangle count, and explore the convergence to the true area.
GeoGebra Commands & Parameters
Segment(A, C) → gSegment(D, B) → hUpperSum(p, x(A), x(B), n) → iLowerSum(p, x(A), x(B), n) → jPoint(q) → EIntegral(p, a, b) → eIntegral(p, a, 0) → sIntegral(p, 0, b) → tTextfield(f) → InputBox1
AI Drawing Prompt Reference
Draw a function graph with rectangles approximating the area under the curve. Include draggable points to set the integration interval, and show upper and lower sum curves in different colors below the function. Have input boxes for the function and display both the exact integral value and the approximated values. Arrange the layout clearly to help understand the concept of integration and how the approximation error changes with the number of rectangles.
The prompt above was compiled from the original drawing commands and is for reference only.