
Function Table Plotting
Loading the math board and drawing, please wait…
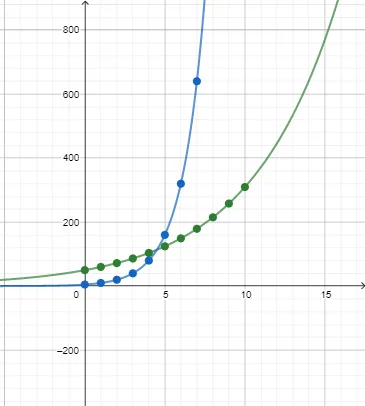
This example demonstrates how to plot function values through a table, visually presenting function graphs and properties. It involves core math concepts like functions, means, complex numbers, tangent functions, geometric transformations, and cones. Construction highlights use of GeoGebra commands/objects f, g for function and table creation. Suitable for high school mathematics teaching, focusing on function graph plotting and property analysis.
GeoGebra Commands & Parameters
f(x) = (50 * 1.2^(x))g(x) = (5 * 2^(x))