
Spirograph Pattern Using Two Complex Exponentials
Loading the math board and drawing, please wait…
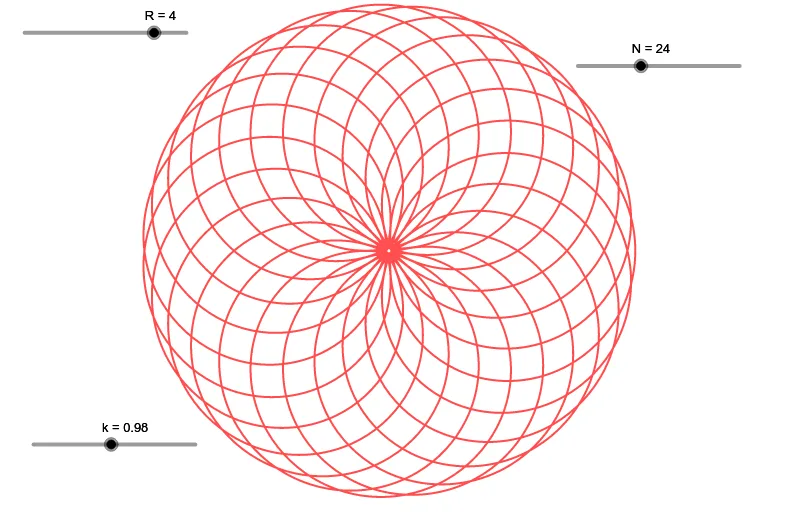
This GeoGebra example demonstrates how to create beautiful Spirograph-like spiral patterns using two complex exponential functions. The core mathematical concepts include the exponential representation of complex numbers, Euler's formula, and parametric equations on the complex plane. Construction details: Using the CurveCartesian command with parameters a (amplitude), k (frequency ratio), and N (number of points), the curve f(t)=a·e^(ikt)+a·e^(it) is plotted on the complex plane. Tmax controls the drawing range while N determines curve precision. This example is suitable for high school and college students learning complex numbers, parametric equations, and trigonometric function visualization, demonstrating the geometric interpretation of complex numbers and exponential function applications.
GeoGebra Commands & Parameters
CurveCartesian(f(t), t, 0, Tmax) → a
AI Drawing Prompt Reference
Plot a parametric curve in the Cartesian plane defined by a complex-valued function of t: f(t)=a·e^(i·k·t)+a·e^(i·t). Use the exponential representation of complex numbers to generate the set of points corresponding to this function. Set the drawing range for the parameter from t=0 to Tmax, and choose the number of points N to control the curve’s precision and smoothness. The resulting locus should form a spirograph-like spiral pattern that reflects the geometric behavior of the two complex exponentials and their combined effect.
The prompt above was compiled from the original drawing commands and is for reference only.