
Function of Two Variables
Loading the math board and drawing, please wait…
In collections
Fun with Functions
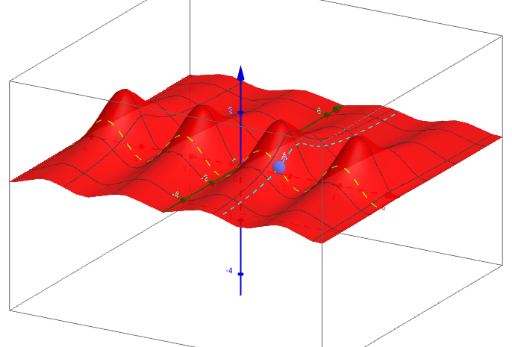
This example demonstrates various properties of a function of two variables at a point. Users can input the function and control which parameters are shown via checkboxes. Key concepts include bivariate functions, derivatives, and tangent lines. GeoGebra commands used include Textfield, Plane, IntersectPath, Derivative, Line, etc. Suitable for university-level mathematics education or research.
GeoGebra Commands & Parameters
Textfield(f) → InputBox1Plane((x_A, 0, 0), (x_A, 1, 0), (x_A, 0, 1)) → xplaneIntersectPath(xplane, f) → xcurveDerivative(f, y) → paryDerivative(f, x) → parxLine(A, B) → LinexPlane((0, y_A, 0), (1, y_A, 0), (0, y_A, 1)) → yplaneLine(A, C) → LineyPlane(Liney, Linex) → aOrthogonalLine(A, a) → normlIntersectPath(yplane, f) → ycurveVector(A, A + (px, py, 0)) → delzIntersectPath(zplane, f) → c
AI Drawing Prompt Reference
Draw a graph of a bivariate function where users can input the function and control which parameters are shown. First, draw a plane and then plot the function curve on it. Next, calculate the partial derivatives of the function with respect to x and y, and draw the corresponding tangent lines. Use these two tangent lines to construct a plane, and then plot the function curve on this plane. Finally, calculate the normal line using the partial derivatives and draw the intersection of this normal line with the function curve near the origin.
The prompt above was compiled from the original drawing commands and is for reference only.