
Function Graphs and Geometric Shapes Demo
Loading the math board and drawing, please wait…
In collections
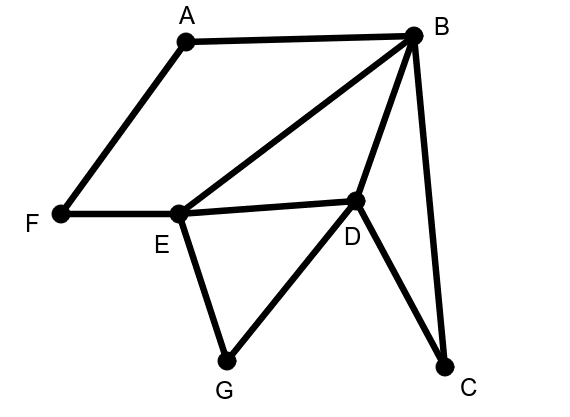
Searching for Eulerian and Hamiltonian Paths
This example dynamically demonstrates function graphs, triangles, and solid geometry. It involves core math concepts like functions, Pythagorean theorem, geometric mean, sequences, and pie charts. Construction highlights include commands like Segment, points (A, B, C), colors (colora, colorb), and counters (countera, counterb). Suitable for high school and above, ideal for teaching or self-learning the integration of functions and geometry.
GeoGebra Commands & Parameters
Segment(A, F) → bSegment(F, E) → aSegment(A, B) → cSegment(B, E) → dSegment(E, D) → eSegment(B, D) → fSegment(C, B) → gSegment(D, C) → hSegment(E, G) → iSegment(G, D) → j
AI Drawing Prompt Reference
Draw a function graph and display multiple triangles and geometric shapes formed by connecting points, including right-angled and isosceles triangles, with different colors for the edges, and incorporate a pie chart to represent the geometric mean of the function, emphasizing the integration of functions and geometry for high school level teaching or self-learning.
The prompt above was compiled from the original drawing commands and is for reference only.