
Parabola Explorer: Symmetry, Fitting, and Dynamic Construction
Loading the math board and drawing, please wait…
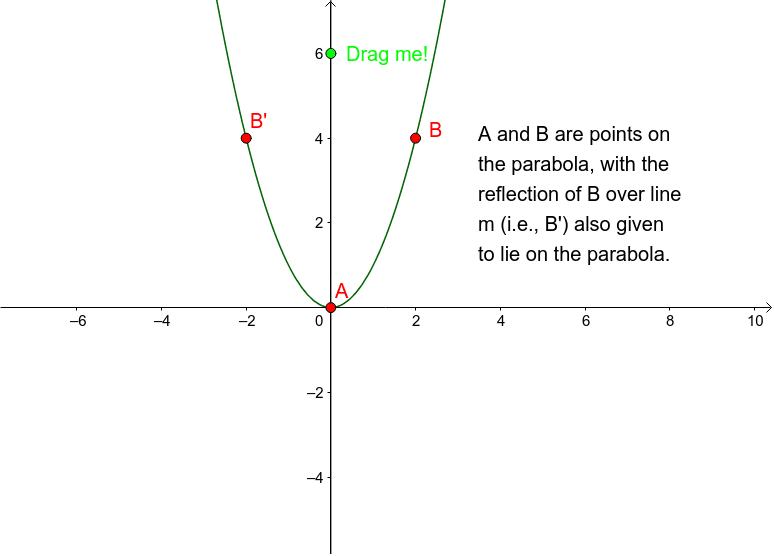
① This GeoGebra example interactively explores the geometric properties of a parabola, demonstrating how to construct and observe a parabola and its axis of symmetry using lines, mirroring, and polynomial fitting. ② Core mathematical concepts include quadratic function graphs, axial symmetry, reflection of a point across a line, and polynomial fitting (FitPoly) to approximate a parabolic equation from discrete points. ③ Construction highlights: the Line command creates a reference line g, the Mirror command reflects point B across g to obtain B', FitPoly fits a quadratic polynomial to the point set theList to generate the parabola f, and text1 displays the equation or explanation; objects A, B, D serve as control points or fitting data, and dynamic adjustments instantly reshape the parabola. ④ Suitable for middle and high school mathematics (quadratic functions in junior high, analytic geometry in senior high) classroom demonstrations, and for teachers creating dynamic courseware to help students intuitively understand parabola symmetry and fitting concepts.
GeoGebra Commands & Parameters
Line(A, D) → gMirror(B, g) → B'FitPoly(theList, 2) → f
AI Drawing Prompt Reference
Draw a parabola and its axis of symmetry. Start with a straight line as the axis, then take a point and reflect it across the line to show symmetry. Next, use a set of discrete points to fit a quadratic curve that approximates them, forming the parabola. Mark several control points whose positions dynamically affect the parabola's shape. Also display the equation or a text note to help observe symmetry and fitting. This illustrates the symmetric property of quadratic graphs and the process of fitting a parabola from points.
The prompt above was compiled from the original drawing commands and is for reference only.