
Fruit Fly Population Growth Model Demo
Loading the math board and drawing, please wait…
In collections
UCSS Secondary Math I Unit 4 Lesson 2
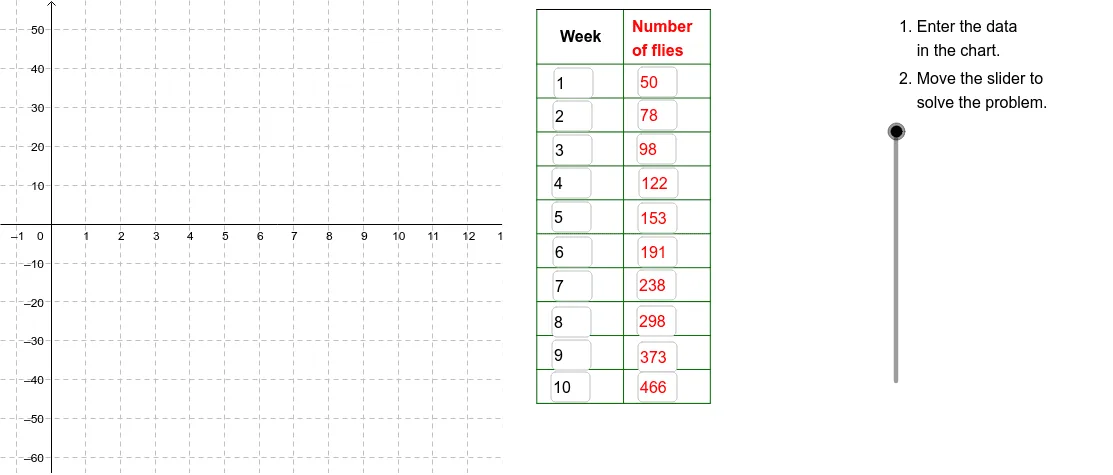
This example demonstrates how to visualize the growth pattern of fruit fly population over time using tables and function graphs. Key math concepts include function modeling, sequences, piecewise functions, and coordinate geometry. Construction highlights involve using Textfield for tables, Polygon for shapes, Sequence for generating data points, and Segment for line segments. Suitable for high school students learning function modeling and data analysis in biology statistics education.
GeoGebra Commands & Parameters
Textfield(A2) → InA2Textfield(A3) → InA3Textfield(A4) → InA4Textfield(A5) → InA5Textfield(A6) → InA6Textfield(A7) → InA7Textfield(A8) → InA8Textfield(A9) → InA9Textfield(A10) → InA10Textfield(A11) → InA11Textfield(B2) → InB2Textfield(B3) → InB3Textfield(B4) → InB4Textfield(B5) → InB5Textfield(B6) → InB6Textfield(B7) → InB7Textfield(B8) → InB8Textfield(B9) → InB9Textfield(B10) → InB10Textfield(B11) → InB11Polygon((13, y(Corner[1])), Corner[2], Corner[3], (13, y(Corner[4]))) → poly1, b, c, d, eSequence(Segment[(14, (-46) + (8.7 * i)), (19, (-46) + (8.7 * i))], i, 0, 10) → CrossList1Segment((14, 55), (19, 55)) → Top1Segment((19, 55), (21.5, 55)) → Top2Segment((21.5, 55), (24, 55)) → Top3Segment((21.5, -46.256410256410255), (21.5, 54.743589743589745)) → Side2Segment((24, -46), (24, 55)) → Side3Sequence(Segment[(21.5, (-46) + (8.7 * i)), (24, (-46) + (8.7 * i))], i, 0, 10) → CrossList3Sequence(Segment[(19, (-46) + (8.7 * i)), (21.5, (-46) + (8.7 * i))], i, 0, 10) → CrossList2Sequence(Segment[(14 + (2.5 * i), (-46)), (14 + (2.5 * i), 55)], i, 0, 2) → SideList1
AI Drawing Prompt Reference
Draw a fruit fly population growth model. Start by creating a table to show the number of fruit flies at different time points. Then, use a line graph to represent the change in fruit fly population over time. Next, draw a rectangular box to represent the fruit flies' habitat. Inside the box, draw vertical and horizontal segments to indicate different areas within the habitat. Finally, use segments to connect these areas, forming a grid-like structure to simulate the movement of fruit flies between different regions.
The prompt above was compiled from the original drawing commands and is for reference only.