
Frequency Polygon Construction by VINOTH
Loading the math board and drawing, please wait…
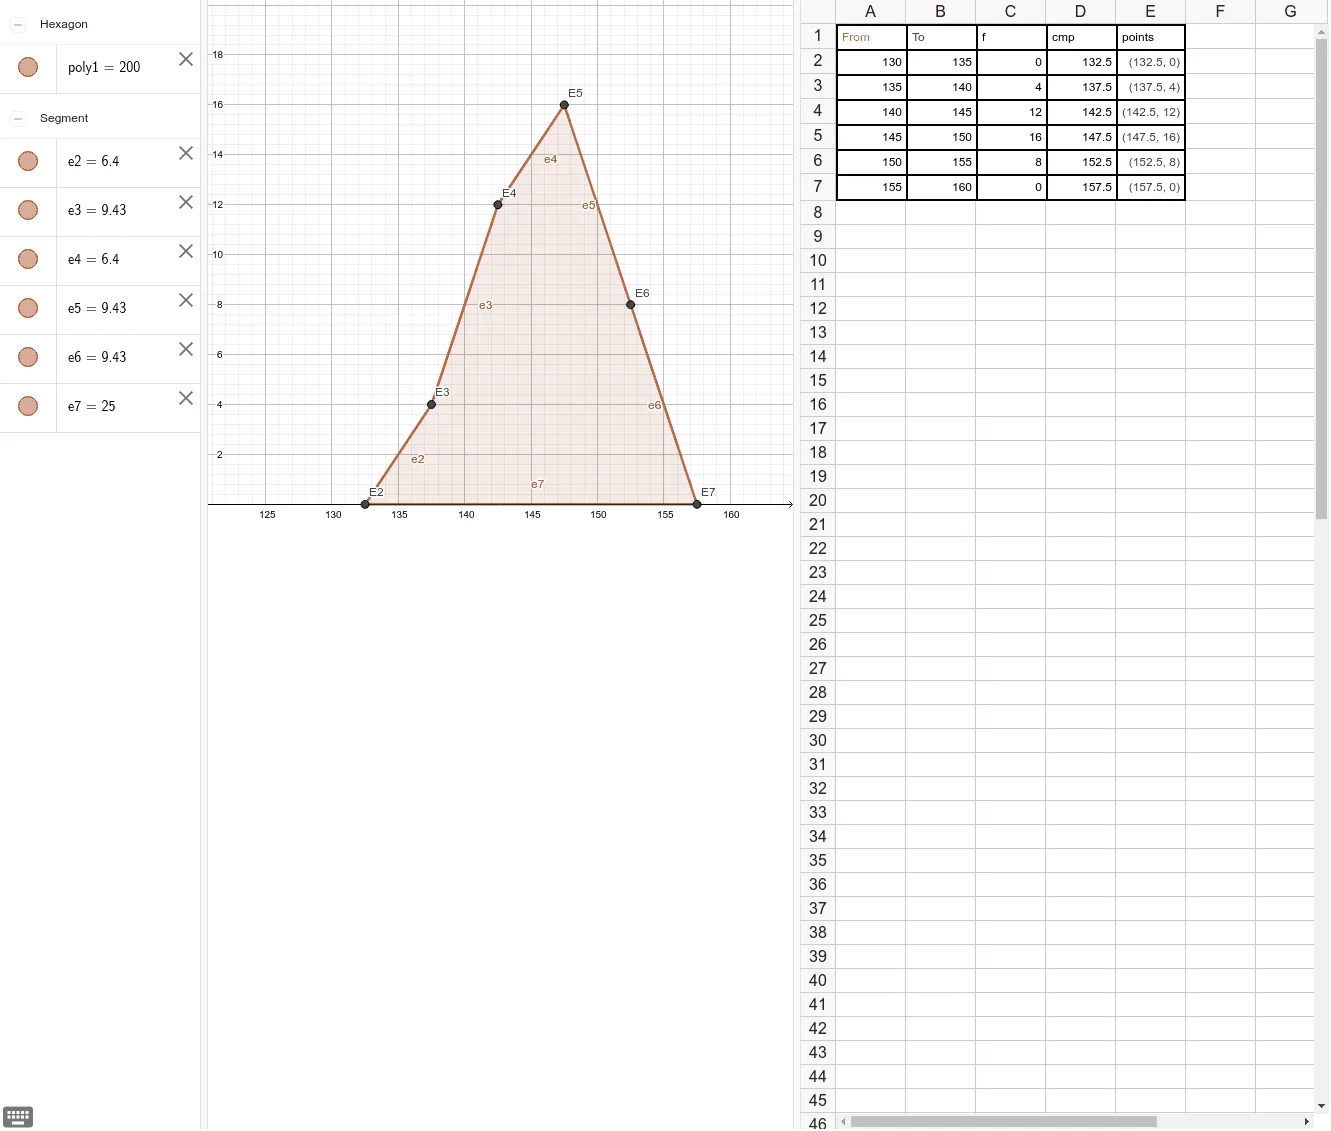
This example demonstrates how to construct a frequency polygon, visually representing data distribution. Key math concepts include statistics (frequency distribution), polygon construction, and coordinate geometry. The GeoGebra command Polygon is used to create the polygon, utilizing objects like points A1-A7, B1-B7, C1-C7, D1-D7, E1-E7, and poly1, showing the process of connecting data points into a polygon. Suitable for high school statistics and analytical geometry courses, teaching the method of drawing frequency polygons and data analysis.
GeoGebra Commands & Parameters
Polygon(E2, E3, E4, E5, E6, E7) → poly1, e2, e3, e4, e5, e6, e7