
Fractions, Decimals, and Percents on a Number Line
Loading the math board and drawing, please wait…
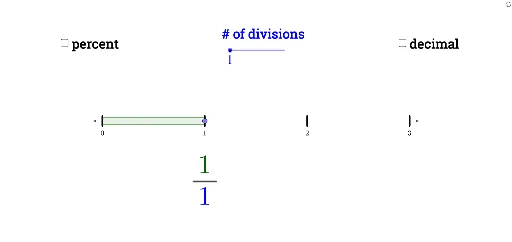
This example demonstrates how to represent fractions, decimals, and percents on a number line. It involves core math concepts such as fractions, decimals, percents, and number line representation. The construction uses GeoGebra commands/objects like Point, Segment, Sequence, If, IntegralBetween, and Vector. Suitable for middle school and above students to understand the representation and conversion of different numerical forms on a number line.
GeoGebra Commands & Parameters
Point({0, 2}) → APoint({1, 2}) → BPoint({2, 2}) → CPoint({3, 2}) → DPoint({0, -2}) → IPoint({1, -2}) → JPoint({2, -2}) → KPoint({3, -2}) → LSegment(I, A) → gSegment(B, J) → hSegment(K, C) → iSegment(D, L) → jSequence(Segment[(i / divisions, 1), (i / divisions, -1)], i, 0, (3 * divisions)) → gridSequence((i / divisions, 0), i, 0, (3 * divisions)) → gridptPoint(gridpt) → slideIf(numerator < 10, 0.115, numerator > 9, 0.175) → xpositionIf(divisions ≟ 10, 0.175, 0.115) → xposdenomIntegralBetween(1.5, -1.5, 0, x(slide)) → aVector((-0.1, 0), (3.1, 0)) → uVector((3.1, 0), (-0.1, 0)) → vIf(percent ≟ 0, 0.825, percent < 100 ∧ percent ≟ round(percent), 0.95, percent < 100 ∧ percent ≠ round(percent), 1.15, percent ≥ 100 ∧ percent ≟ round(percent), 1.075, percent > 100 ∧ percent ≠ round(percent), 1.275) → perposSegment((x(slide) - 0.11, -25), (x(slide) + 0.11, -25)) → fractionbarIf(divisions ≟ 10, 0.0555, 0.0587) → slidepos
AI Drawing Prompt Reference
Draw a horizontal line representing fractions, decimals, and percents, with four points marked on it to form horizontal segments. Grid lines are drawn on the line. A point is marked on the grid according to the slider's position, and a vertical segment is drawn from this point. Depending on the value of the percent, marks are placed below the vertical segment at different positions to represent various numerical forms.
The prompt above was compiled from the original drawing commands and is for reference only.