
Exponential and Logarithmic Functions Interactive Demo
Loading the math board and drawing, please wait…
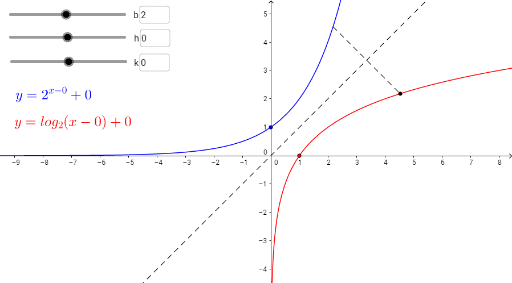
This GeoGebra example dynamically demonstrates the relationship between exponential and logarithmic functions, including their graphs, intersection points, and how parameter changes affect the curves. Core mathematical concepts include exponential functions, logarithmic functions, inverse relationships, function transformations, and inequalities. Construction highlights: using Textfield to create input boxes, InputBox1/2/3 to control parameters b, h, k, Point and Intersect commands to mark key points A, B, C, D, Segment to connect lines, and defining functions f, g, i along with auxiliary objects j, l. Suitable for high school and above students to explore function properties, and for teachers to demonstrate in class, helping learners intuitively grasp the geometric meaning of exponential and logarithmic functions as inverses, as well as the effects of parameter shifts and scaling on graphs.
GeoGebra Commands & Parameters
Textfield(b) → InputBox1Textfield(h) → InputBox2Textfield(k) → InputBox3Point(g) → CIntersect(f, j, (2.182692297509452, 4.539999999978796)) → DSegment(D, C) → l