
Sine Function Transformations: Visualizing y=A sin[b(x-h)]+k
Loading the math board and drawing, please wait…
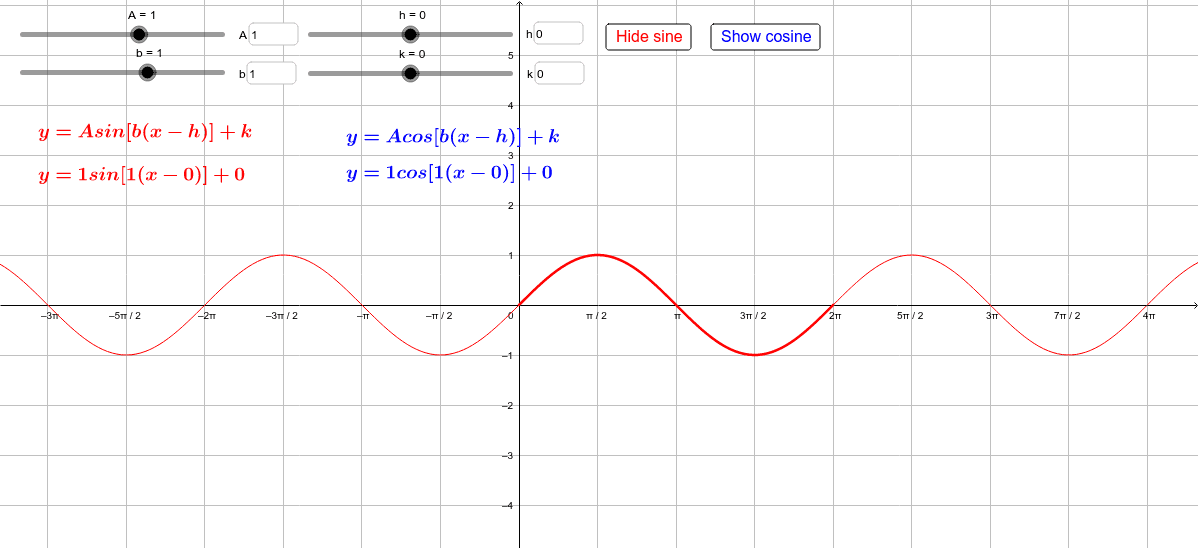
This GeoGebra example demonstrates the transformations of the sine function y=A sin[b(x-h)]+k through interactive parameter adjustment. Users can manipulate four InputBoxes to change amplitude A, frequency parameter b, horizontal shift h, and vertical shift k, observing real-time image changes. Key mathematical concepts include: amplitude controls the range, parameter b affects period, horizontal shift h moves the graph within the parentheses, and vertical shift k changes the baseline. Construction uses Sine/Cosine commands for graphing, InputBoxes for parameter input, Textfield for labels, and buttons to toggle between sine and cosine displays. Ideal for high school trigonometry units, this interactive tool helps students intuitively understand how parameters A, b, h, and k affect function graphs.
GeoGebra Commands & Parameters
Textfield(A) → InputBox1Textfield(h) → InputBox2Textfield(b) → InputBox3Textfield(k) → InputBox4Textfield(A) → InputBox1_1Textfield(h) → InputBox2_1Textfield(b) → InputBox3_1
AI Drawing Prompt Reference
Draw a sine function graph with sliders to control amplitude, frequency parameter, horizontal shift, and vertical shift, observing the effect of parameter changes on the graph. Use sine and cosine commands for plotting, and add text boxes to label parameter names and values, with a button to toggle between sine and cosine displays.
The prompt above was compiled from the original drawing commands and is for reference only.