
Quadratic Functions Challenge: Interactive Exploration of Forms and Graphs
Loading the math board and drawing, please wait…
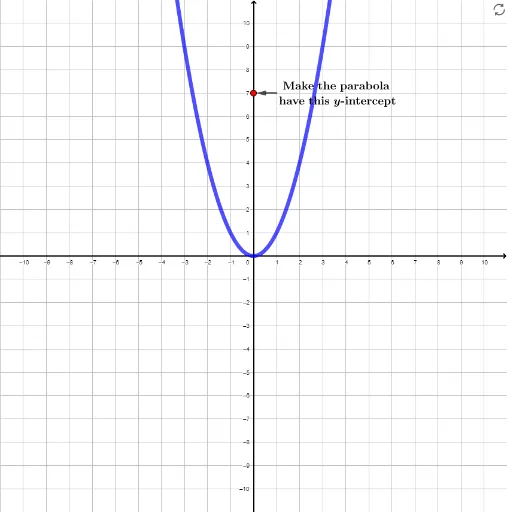
This interactive challenge focuses on quadratic functions, demonstrating the relationships among the standard form, factored form, and vertex form of a parabola. Core mathematical concepts include how coefficients affect the direction, vertex, and roots of the parabola, and the correspondence between algebraic expressions and graphical features. The construction uses GeoGebra commands such as If, Random, Point, Textfield, Derivative, Root, Vector, and Polygon to generate random quadratic functions, with input boxes allowing users to guess the target vertex or roots and receive instant feedback. Suitable for middle and high school students learning quadratic function properties, factoring, completing the square, and graph transformations, this activity strengthens the connection between symbolic algebra and visual graphs through engaging practice.
GeoGebra Commands & Parameters
If(d, ((-b)) / ((2 * a)), If[e, (r + s) / 2, If[f, h]]) → xvertexIf(d, standardform(xvertex), If[e, factoredform(xvertex), If[f, vertexform(xvertex)]]) → yvertexRandom(-10, 10) → yintgoalRandom(-10, 10) → root1goalRandom(-10, 10) → root2goalRandom(1, 3) → diceRandom(-10, 10) → xvertgoalRandom(-10, 10) → yvertgoalPoint({xvertgoal, yvertgoal}) → vertexgoalIf(d, standardform, If[e, factoredform, vertexform]) → chosenIf(dice ≟ 1, chosen(root1goal) ≟ 0 ∧ chosen(root2goal) ≟ 0, If[dice ≟ 2, xvertex ≟ root1goal ∧ yvertex ≟ 0, (yvertex * a) > 0]) → gotxTextfield(a) → InputBox1Derivative(test) → dtestRoot(test) → testroots_1, testroots_2Vector((root1goal + 2.4 - (1.2 / 5 * (root1goal + 10)), -1), B) → vVector((root1goal / 2 + root2goal / 2 - 1 - (2.7 / 9.5 * (root1goal / 2 + root2goal / 2)), -1.9), If[x(C) < x(B), C, B]) → wVector((root1goal / 2 + root2goal / 2 + 1 - (2.7 / 9.5 * (root1goal / 2 + root2goal / 2)), -1.9), If[x(C) < x(B), B, C]) → gVector((1, y(A)), A + (0.1, 0)) → uVector((xvertgoal + 1.2 - (3 / 20 * (xvertgoal + 10)), yvertgoal - 0.9 + If[yvertgoal ≟ -10, 1.8, 0]), vertexgoal) → iVector((root1cust + 2.4 - (1.2 / 5 * (root1cust + 10)), -1), E) → v_1Vector((root1cust / 2 + root2cust / 2 - 1 - (2.7 / 9.5 * (root1cust / 2 + root2cust / 2)), -1.9), If[x(E) < x(F), E, F]) → w_1Vector((root1cust / 2 + root2cust / 2 + 1 - (2.7 / 9.5 * (root1cust / 2 + root2cust / 2)), -1.9), If[x(E) < x(F), F, E]) → g_1Vector((1, y(D)), D + (0.1, 0)) → u_1Vector((xvertcust + 1.2 - (3 / 20 * (xvertcust + 10)), yvertcust - 0.9 + If[yvertcust ≟ -10, 1.8, 0]), vertcust) → i_1Textfield(b) → InputBox2Textfield(c) → InputBox3Textfield(r) → InputBox4Textfield(s) → InputBox5Textfield(h) → InputBox6Textfield(k) → InputBox7Vector(G, H) → pPolygon(I, J, K, L) → q1, i_2, j_1, k_1, l_1
AI Drawing Prompt Reference
Create an interactive graph showing quadratic functions in standard, factored, and vertex forms, with randomly generated parabolas displaying vertices and roots. Allow users to input guesses for the vertex or roots to receive instant feedback. Include sliders for coefficients, show derivatives and coordinate geometry relationships, and use polygons and vectors to highlight key points.
The prompt above was compiled from the original drawing commands and is for reference only.