
Exploring the Slope of a Line
Loading the math board and drawing, please wait…
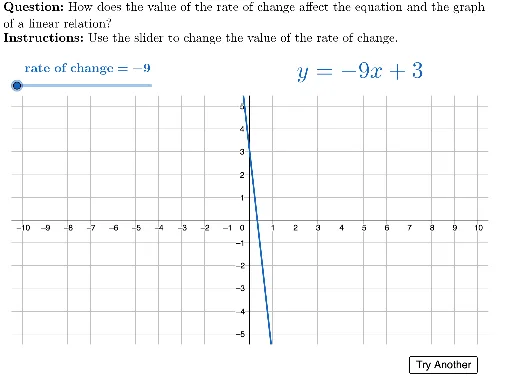
This example demonstrates how to visually explore the relationship between a linear equation and its graph by dynamically adjusting the slope and y-intercept parameters. Key math concepts include linear equations (y=mx+b), slope, y-intercept, and coordinate geometry. It utilizes GeoGebra commands like Random, LaTeX, and Polygon, along with objects such as TryAnother, m, b, f, equation, viewBox, mLabel, QUESTION, INSTRUCTIONS, and TEXT for interactive exploration and parameterized demonstration. Suitable for high school students to understand the geometric meaning of linear equations and the effects of slope and intercept on line positioning.
GeoGebra Commands & Parameters
Random(-4, 4) → bLaTeX("\vphantom{1}" + f) → equationPolygon({(-10.5, -5.5), (-10.5, 5.5), (10.5, 5.5), (10.5, -5.5)}) → viewBoxLaTeX(("\text{rate of change}=" * m)) → mLabelLaTeX("\textbf{Question: }How does the value of the rate of change affect the equation and the graph\\of a linear relation?") → QUESTIONLaTeX("\textbf{Instructions: }Use the slider to change the value of the rate of change.") → INSTRUCTIONS